
INDUSTRY ANALYSIS
OpenAI’s Annualized Revenue Falls Short of Earlier Reports: What $50 Billion Versus $70 Billion Says About AI Bubble Risk
The Financial Times reported that OpenAI’s annualized revenue approached $50 billion at the end of September, below the roughly $70 billion previously circulating and prompting concerns about AI growth. Differences in calculation mean this cannot simply be read as a decline in actual revenue. IndustryAtlas sees $50 billion as a positive sign of rising revenue and expanding commercialization compared with earlier figures. However, complete, current cost and cash-flow data remain insufficient to determine whether breakeven can arrive sooner. This article examines the reporting discrepancy, then uses three Anthropic cost scenarios to show how investors can assess growth, profitability, and bubble risk.
On October 8, 2026, the Financial Times (FT) reported that information OpenAI provided to investors showed annualized revenue approaching $50 billion at the end of September, below the roughly $70 billion previously reported in the media.[1]
For a market that had already accepted the higher figure, this naturally looked disappointing. The first questions, however, are whether the figures were calculated on the same basis and whether they describe realized revenue, a revenue run rate at a particular moment, or a future target.
$50 Billion Versus $70 Billion: First Check the Calculation
Reuters subsequently cited a person familiar with the matter confirming the figure near $50 billion, noting that the earlier discrepancy mainly involved adjustments to the revenue basis for comparison with Anthropic.[2]
The more accurate description is therefore “below earlier reports and market expectations.” The available evidence does not establish that revenue on a comparable basis fell from $70 billion to $50 billion, or allow a business contraction to be calculated from those figures.
Annualized revenue typically extrapolates revenue from one month or another short period to a full year, indicating the business’s pace at that point. Using one month multiplied by twelve, $50 billion implies a monthly revenue pace of about $4.17 billion. This does not mean $50 billion has already been earned this year or guarantee that the same pace will continue for the next twelve months.
Cross-company comparisons also require checking how channel revenue is recognized. Different treatment of partner-related sales changes the presentation of both revenue and expenses. Gross, net, and revenue-sharing definitions must be checked before comparing companies; a larger revenue number alone does not establish higher profitability.
As of this article’s update, Bloomberg also reported on October 9 that OpenAI expected annualized revenue to reach or exceed $70 billion by year-end.[5] This is a new forward-looking target and should be distinguished from earlier reporting about September.
| Reported figure | Timing and nature | How to interpret it |
|---|---|---|
| Approximately $70 billion | The previously circulating September annualized revenue figure | Involves adjustments for cross-company comparison and cannot simply be treated as a realized figure on the same accounting basis.[1][2] |
| Nearly $50 billion | End-September annualized revenue reported on October 8 | An indicator of the revenue pace at that time, not a full-year financial statement.[1][2] |
| At least $70 billion | Year-end annualized revenue target reported on October 9 | A forecast yet to be realized, not a substitute for September revenue.[5] |
The gap relative to market expectations matters, but it cannot be treated as evidence that AI demand has already contracted without making these distinctions.
IndustryAtlas’s View: $50 Billion Remains a Positive Revenue Signal
In an official article published in January 2026, OpenAI’s CFO disclosed that annualized revenue exceeded $20 billion in 2025.[3] Comparing that approximate starting point with the latest figure near $50 billion, assuming the bases are comparable, suggests a revenue pace roughly 2.5 times as large, or about 150% higher. This is not full-year revenue growth; the precise increase still requires complete data.
In a follow-up report on October 9, the FT also said the company’s annualized revenue pace grew about 70% in the third quarter and that its 2026 full-year revenue estimate had risen from $30 billion to $35 billion.[4] These provide evidence of strong recent expansion. The full-year estimate remains a forecast, however, and cannot be used interchangeably with the $50 billion annualized measure.
IndustryAtlas’s interpretation is that, although $50 billion is below the previously circulating $70 billion, it remains an encouraging sign of commercialization compared with earlier revenue levels. Paying demand is generating a larger revenue base, an important indication that AI applications are developing into businesses.
These figures support the conclusions that the revenue pace has risen substantially and recent expansion has been strong. Establishing that the growth rate continues to accelerate would require consecutive quarterly data on a consistent basis. The $50 billion figure alone cannot demonstrate that.
Can Faster Growth Bring OpenAI to Breakeven Earlier?
Higher revenue creates an opportunity to improve profitability. Whether it brings breakeven forward depends on how much contribution remains after the associated costs, and how much the company simultaneously adds to training, personnel, and other spending.
Public information is not entirely devoid of cost indicators. What is missing is a complete, reconcilable set of cost and cash-flow data that matches the latest revenue figures. We cannot yet clearly reconstruct the split between inference and training, utilization of reserved capacity, channel and stock-based compensation burdens, or the timing of future payments.
| Possible situation | Effect on the path to breakeven |
|---|---|
| New customers absorb existing spare capacity with limited incremental expense | Margins could improve and breakeven could arrive earlier. |
| Revenue growth requires substantial additional compute, but unit contribution improves | Profitability may improve, although the cash needed during expansion still requires examination. |
| Price cuts stimulate usage while training and infrastructure spending rise even faster | Losses could expand despite rapid revenue growth. |
These are analytical scenarios, not findings about OpenAI’s current cost structure. A more positive view of the revenue side is warranted; judgment on faster breakeven should remain open until complete costs, margins, and cash flows can be assessed.
The following sections use Anthropic’s relatively better-documented compute arrangements to illustrate how breakeven requirements can be estimated. The three scenarios and charts are the author’s model for Anthropic; OpenAI’s $50 billion annualized revenue must not be inserted directly into them.
Separate Operating Losses, Funding Pressure, and Valuation Bubbles
Assessing whether AI model companies are in a bubble requires separating three questions.
| Level of analysis | Question to answer | Main evidence needed |
|---|---|---|
| Business model | Can revenue cover inference, training, personnel, and channel expenses? | Complete costs, normalized margins, customer retention, and pricing |
| Funding resilience | Can the company meet the next stage of cash spending? | Available cash, cash-flow statements, payment schedules, and debt actually drawn |
| Equity valuation | Can future returns distributable to shareholders justify the purchase price? | Diluted share count, free cash flow, duration of growth, and valuation multiples |
A company can keep losing money without an immediate payment crisis if it has sufficient funding. It can also be profitable while its share price assumes too much future growth. Breakeven in 2030 is therefore a threshold for testing economic viability, not proof that today’s valuation is reasonable.
Anthropic serves here as a case study of an independent model company. The analytical approach can be applied to OpenAI or other businesses, but different revenue mixes, compute allocations, financing terms, and distribution arrangements mean the same growth rate cannot simply be reused.
What Information Is Available About Anthropic?
In June 2026, Anthropic announced that it had confidentially submitted a draft S-1 to the SEC. At the time of this article’s review, a complete public prospectus that could be checked line by line was not available. Some financial figures below therefore come from materials obtained by Reuters and other media, rather than the author’s direct review of complete company financial statements.[6][7]
Amounts in this English text and its tables are in US dollars, generally expressed in billions. The retained original charts use units of US$100 million; ten such units equal US$1 billion.
| Item | Currently available figure | How it should be used |
|---|---|---|
| 2025 revenue | About $4.6 billion | Historical figure reported by media from the prospectus.[7] |
| 2025 operating costs and expenses | $12.65 billion | Compared with revenue, implies an operating loss of about $8.1 billion; not directly equivalent to cash burn.[7] |
| Of which: compute and infrastructure spending | $7.33 billion | Already included in the costs above; do not add it again.[7] |
| Q1 2026 revenue | About $4.8 billion | Quarterly figure reported by media.[8] |
| Q2 2026 revenue | About $11.5 billion | Media-reported figure that still requires reconciliation with complete official statements.[9] |
| Revenue run rate at the end of July 2026 | More than $65 billion | Indicates the pace at that time, not realized full-year revenue.[10] |
| 2026 full-year revenue used in this article | $55 billion | Author’s estimate, with a $50–60 billion range used as a reasonableness check; not company guidance. |
Of the approximately $42 billion net loss in 2025, about $34 billion came from noncash valuation changes in convertible financing instruments. The entire reported net loss therefore cannot be treated as cash paid out that year.[7]
Conversely, reports that adjusted operating income turned positive in 2026 do not establish that all costs were covered. The adjustments exclude items such as stock-based compensation, while some high gross-margin figures reported in the media use definitions before channel revenue sharing and model-training costs. The company should eventually provide a complete reconciliation from adjusted measures to formal financial statements.[11]
The $55 billion full-year estimate begins with about $16.3 billion of revenue in the first two quarters and assumes continued growth in the second half. It implies about $38.7 billion in second-half revenue, averaging roughly $6.45 billion per month. That requires further improvement over the monthly revenue implied by the end-July run rate. The starting point itself is therefore an assumption that needs validation.
Compute Contracts Indicate the Scale of Costs, but Are Not Annual Income Statements
Reuters reported that Anthropic had at least approximately $518 billion of infrastructure commitments over roughly the next decade, about 80% of which could not be freely canceled or would require payment even if unused.[12]
This is a significant risk signal: expenses may not fall alongside slower demand. But a multiyear contractual total is neither debt already borrowed nor a bill payable entirely in one year.
The following simply divides each contract amount by its duration to estimate its average annual scale.
| Arrangement | Reported or filed total | Duration | Simple annual average |
|---|---|---|---|
| $111.1 billion | April 2026–July 2033, about 88 months | About $15.2 billion | |
| AWS | $110.0 billion | May 2026–April 2036, about 120 months | About $11.0 billion |
| Microsoft | $31.4 billion | November 2026–May 2033, about 79 months | About $4.8 billion |
| Specific Broadcom TPU lease arrangement | $125.2 billion | Five years | About $25.0 billion |
| Two Akamai projects | $11.6 billion | Seven years from each project’s service commencement | About $1.7 billion |
Sources: Reuters citing company materials for Google, AWS, and Microsoft; Reuters citing supplier documents for Broadcom; and Akamai’s SEC Form 8-K.[12][13][14] Durations use approximate month counts, not annual payment schedules.
Assuming these arrangements can be counted separately without offsets, the sum of the unrounded simple annual averages is approximately $57.6 billion. This is only a scale reference across different start dates and durations. It is not 2026 costs, 2030 costs, or a confirmed annual minimum expenditure. Full contracts would need to be checked for delivery, usage, offsets, and overlapping scope.
At least four further pieces of information are needed to move from commitments to the income statement:
1. Delivery timing. Compute capacity comes online in stages; averages do not show each year’s ramp-up. 2. Payment and recognition. Prepayments, capital expenditure, lease principal, depreciation, and interest affect cash flow and earnings differently. 3. Cancellation or replacement rights. The reported xAI compute arrangement runs through 2029 and has cancellation provisions. Continued use in 2030 would require a separate estimate for renewal or replacement costs.[12] 4. Double counting. Broadcom’s specific five-year arrangement cannot be added again to aggregate lease obligations that already include it. Financing used to pay leases cannot be counted as another operating expense.
For example, Broadcom’s convertible financing arrangement of up to $42 billion is a funding source, not a cost discount. It also does not mean Anthropic has drawn the entire facility.[13] Actual amounts drawn, interest, conversion terms, and maturity dates all need to be examined.
Three Anthropic Scenarios: How Much Growth Is Needed by 2030?
This article defines its target as normalized pretax breakeven: including inference and training costs, depreciation, stock-based compensation, and net interest, while excluding hard-to-predict valuation changes in financing instruments. This is the article’s analytical definition, not a company-reported measure. It is also not equivalent to positive GAAP net income or free cash flow.
The model splits 2030 costs into two components: a scenario-specific annual budget for compute and other costs, F; and channel fees and stock-based compensation estimated as a share of revenue, v.
Normalized pretax profit = revenue × (1 − v) − F Breakeven revenue = F ÷ (1 − v) Required compound annual growth rate = (2030 breakeven revenue ÷ 2026 revenue)^(1/4) − 1
There are four growth periods between full-year 2026 and full-year 2030. Compound annual growth describes the change between the starting and ending values; it does not require an identical increase every year.
| 2030 assumption / calculation | Efficiency improvement | Base case | Cost pressure |
|---|---|---|---|
| Annual compute and infrastructure costs | $75 billion | $100 billion | $135 billion |
| Other annual costs | $15 billion | $25 billion | $35 billion |
| Combined F | $90 billion | $125 billion | $170 billion |
| Channel fees and stock-based compensation as a share of revenue, v | 10% | 15% | 20% |
| Required breakeven revenue | $100.0 billion | $147.1 billion | $212.5 billion |
| CAGR from a $55 billion starting point | 16.1% | 27.9% | 40.2% |
All 2030 costs, expense ratios, and results in the table are the author’s scenario assumptions and calculations. They are not Anthropic guidance or figures that can be precisely derived from compute contracts. No probabilities are assigned to the scenarios.
Efficiency Improvement Requires Stronger Cost Control
This scenario assumes better model efficiency and hardware utilization, paying demand that absorbs reserved capacity, and a higher share of direct sales. Compute costs in 2030 are set at $75 billion, still above the earlier contract-average scale reference, but with additional expansion controlled.
Under these assumptions, a CAGR of about 16% reaches breakeven. This lower threshold does not mean slower growth is necessarily safe: costs and revenue must also remain aligned.
Base Case: Around 30% Growth Approaches the Threshold; 35% Provides More Headroom
The base case assumes continued expansion of training and inference capacity, taking compute costs to $100 billion in 2030. Cash compensation, other R&D, administration, marketing, and net interest total another $25 billion. Channel fees are estimated at 8% of revenue and stock-based compensation at 7%, for a combined 15%. All are assumptions used in this article.
Required revenue is about $147.1 billion, equivalent to roughly 28% CAGR over four years from $55 billion. At 30% growth, 2030 revenue would be about $157.1 billion, normalized pretax profit about $8.5 billion, and the margin only about 5.4%.
At 35% growth, revenue would be about $182.7 billion and normalized pretax profit approximately $30.3 billion. We therefore treat 30% as a monitoring threshold for the base case and 35% as a path with more headroom. That headroom assumes the planned capacity can serve the additional demand. If growth requires more compute, the cost budget must also rise.
Cost Pressure Requires More Than 40% Growth
This scenario assumes that price competition, training expansion, unused capacity, and higher financing costs simultaneously increase pressure. Compute and other annual costs reach a combined $170 billion, with channel fees and stock-based compensation at 20% of revenue.
The company would need $212.5 billion in revenue, corresponding to approximately 40.2% CAGR. At only 30% growth, its 2030 normalized pretax loss would be about $44.3 billion. Even sustained rapid revenue growth may fail to keep up with expanded expenses.
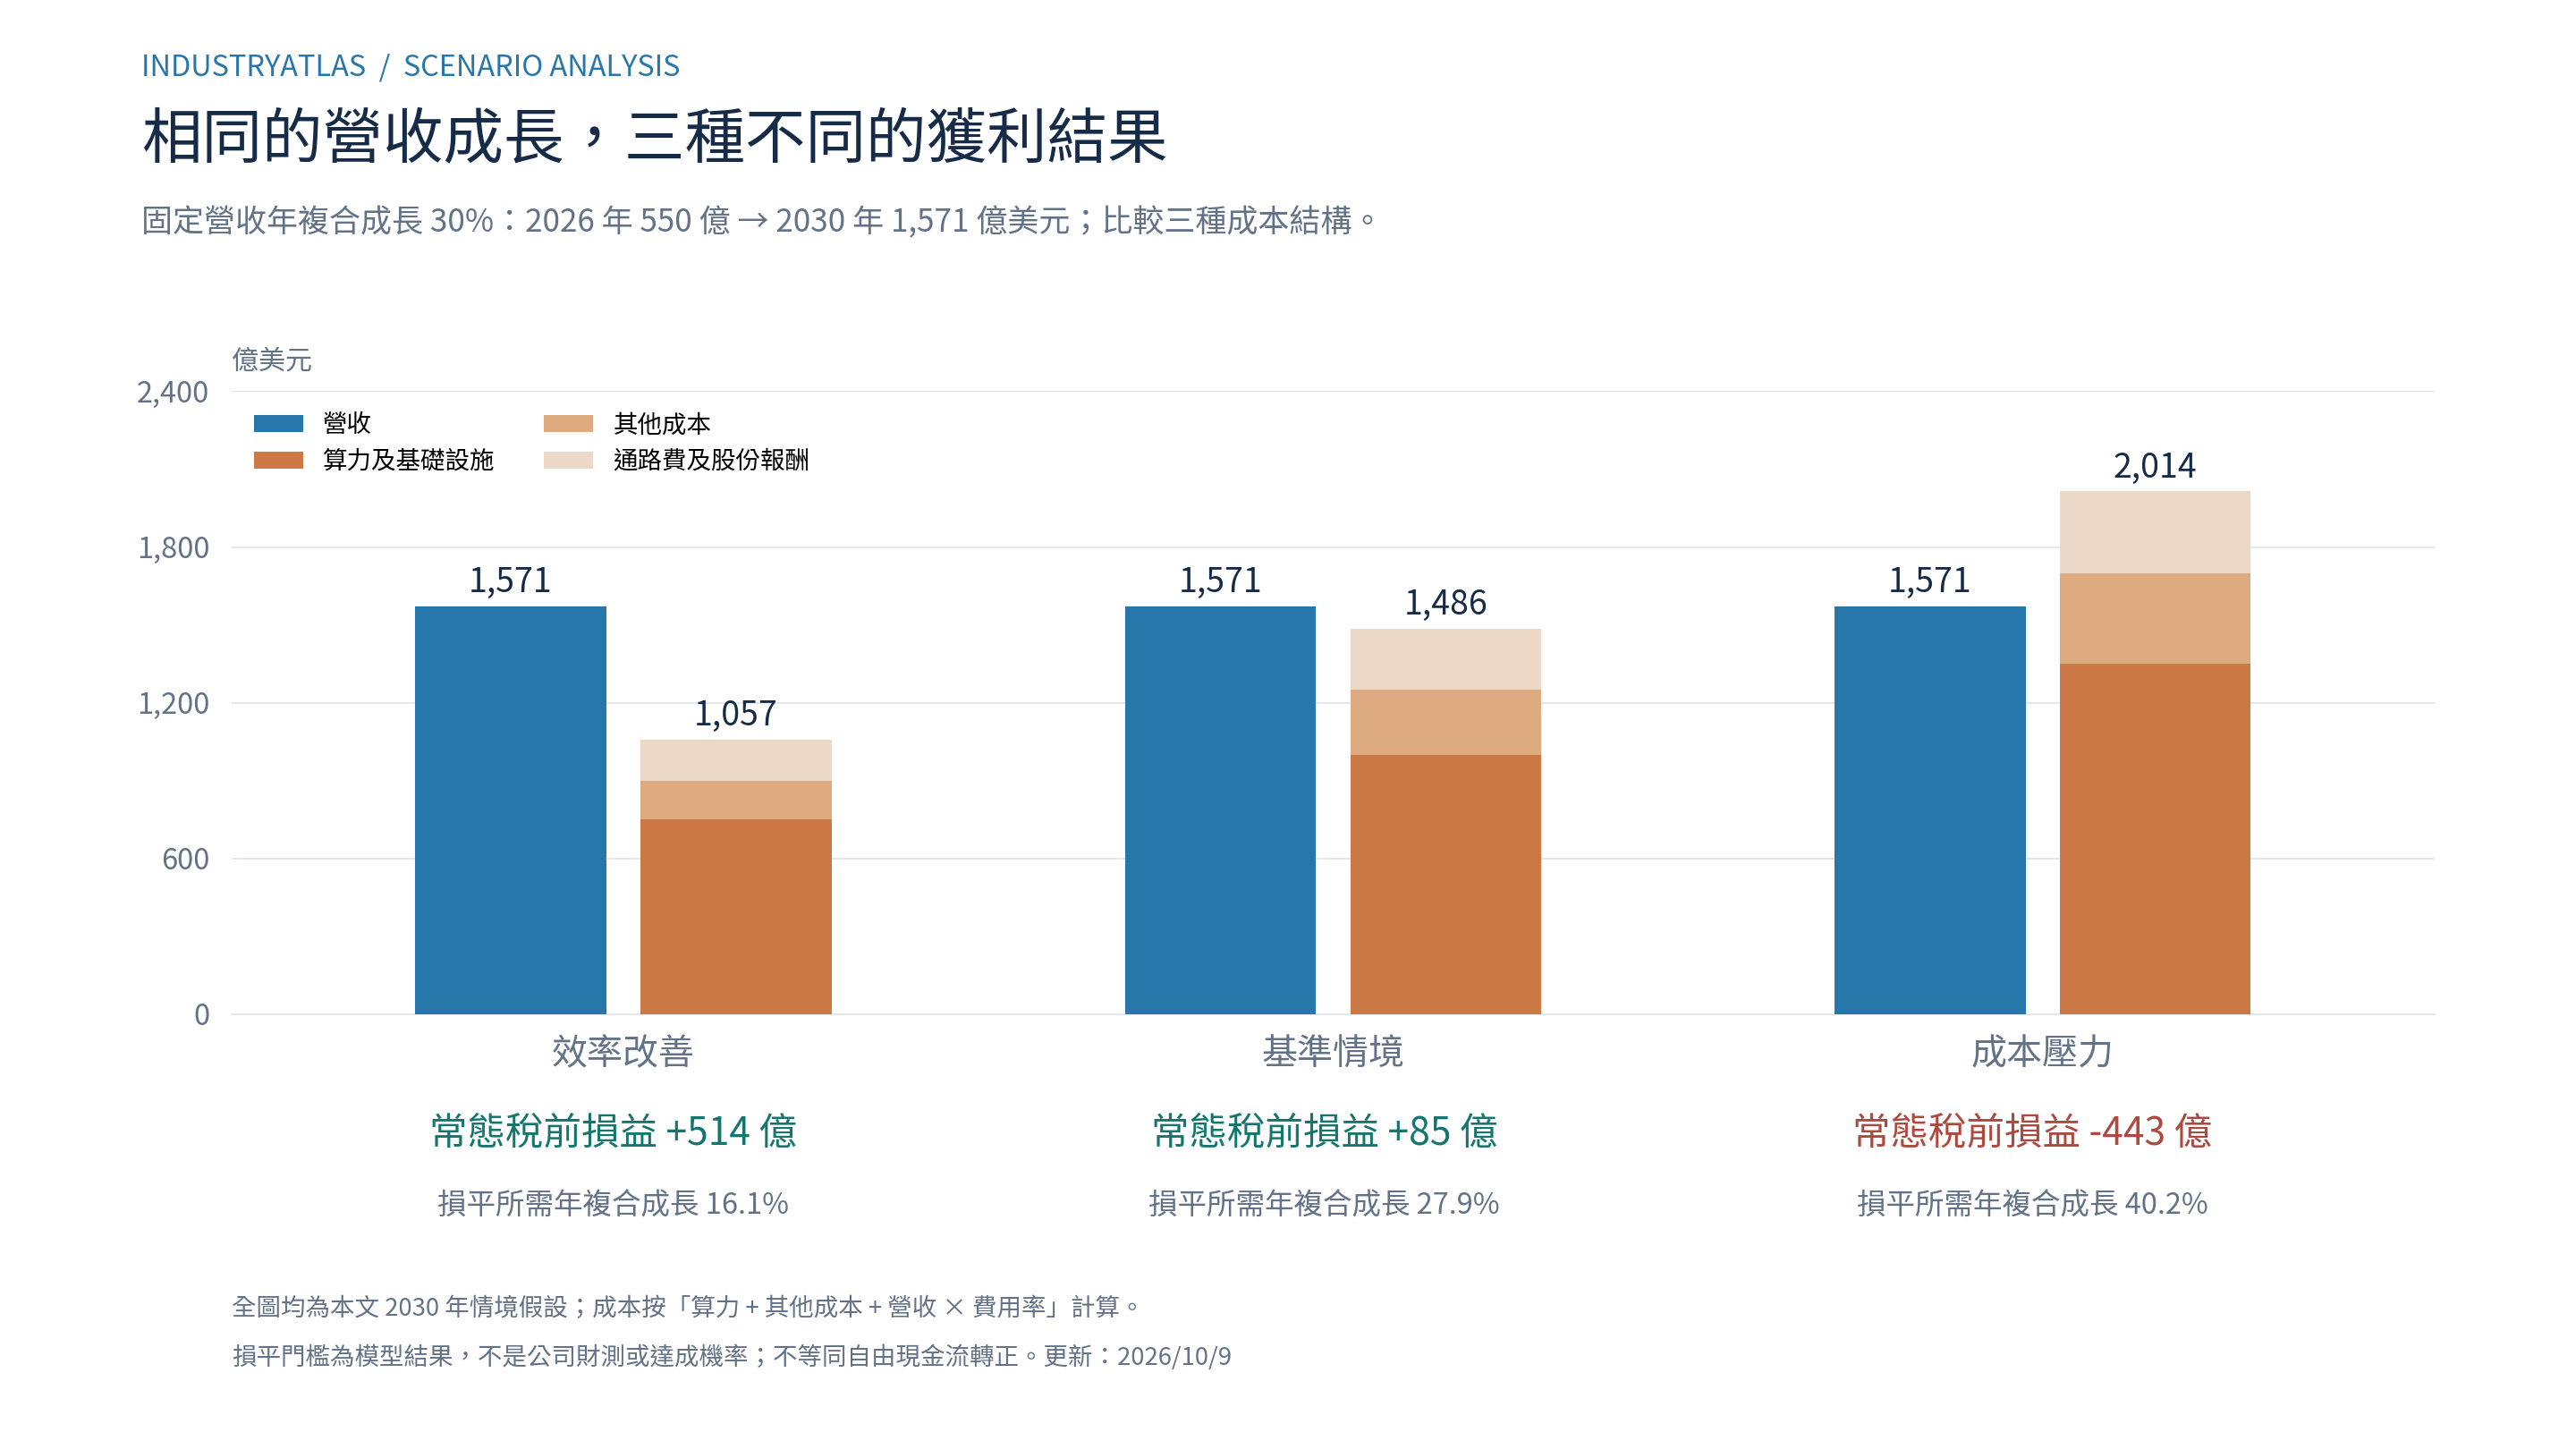
Figure 1: Cost sensitivity under the same revenue path, with revenue of $157.1 billion in all three scenarios. The breakeven growth rates shown below are calculated separately for each scenario. All figures are the author’s estimates. The original chart’s monetary unit is US$100 million.
Reading Anthropic’s Revenue and Cost Charts on the Path to 2030
The chart below shows media-reported historical operating figures for 2025 on the left and this article’s 2026–2030 base-case path on the right. Full-year 2026 revenue remains an estimate. Costs for that year are left blank because complete full-year data are unavailable; the blank does not mean zero.
To illustrate the intervening years, the article further assumes that F rises linearly from $75 billion in 2027 to $125 billion in 2030. Both the 2027 starting point and the linear progression are illustrative chart assumptions, not contractual payment schedules or company annual forecasts. “Turning positive in 2030” is therefore a result of these assumptions, not a definitive prediction of the first profitable year.
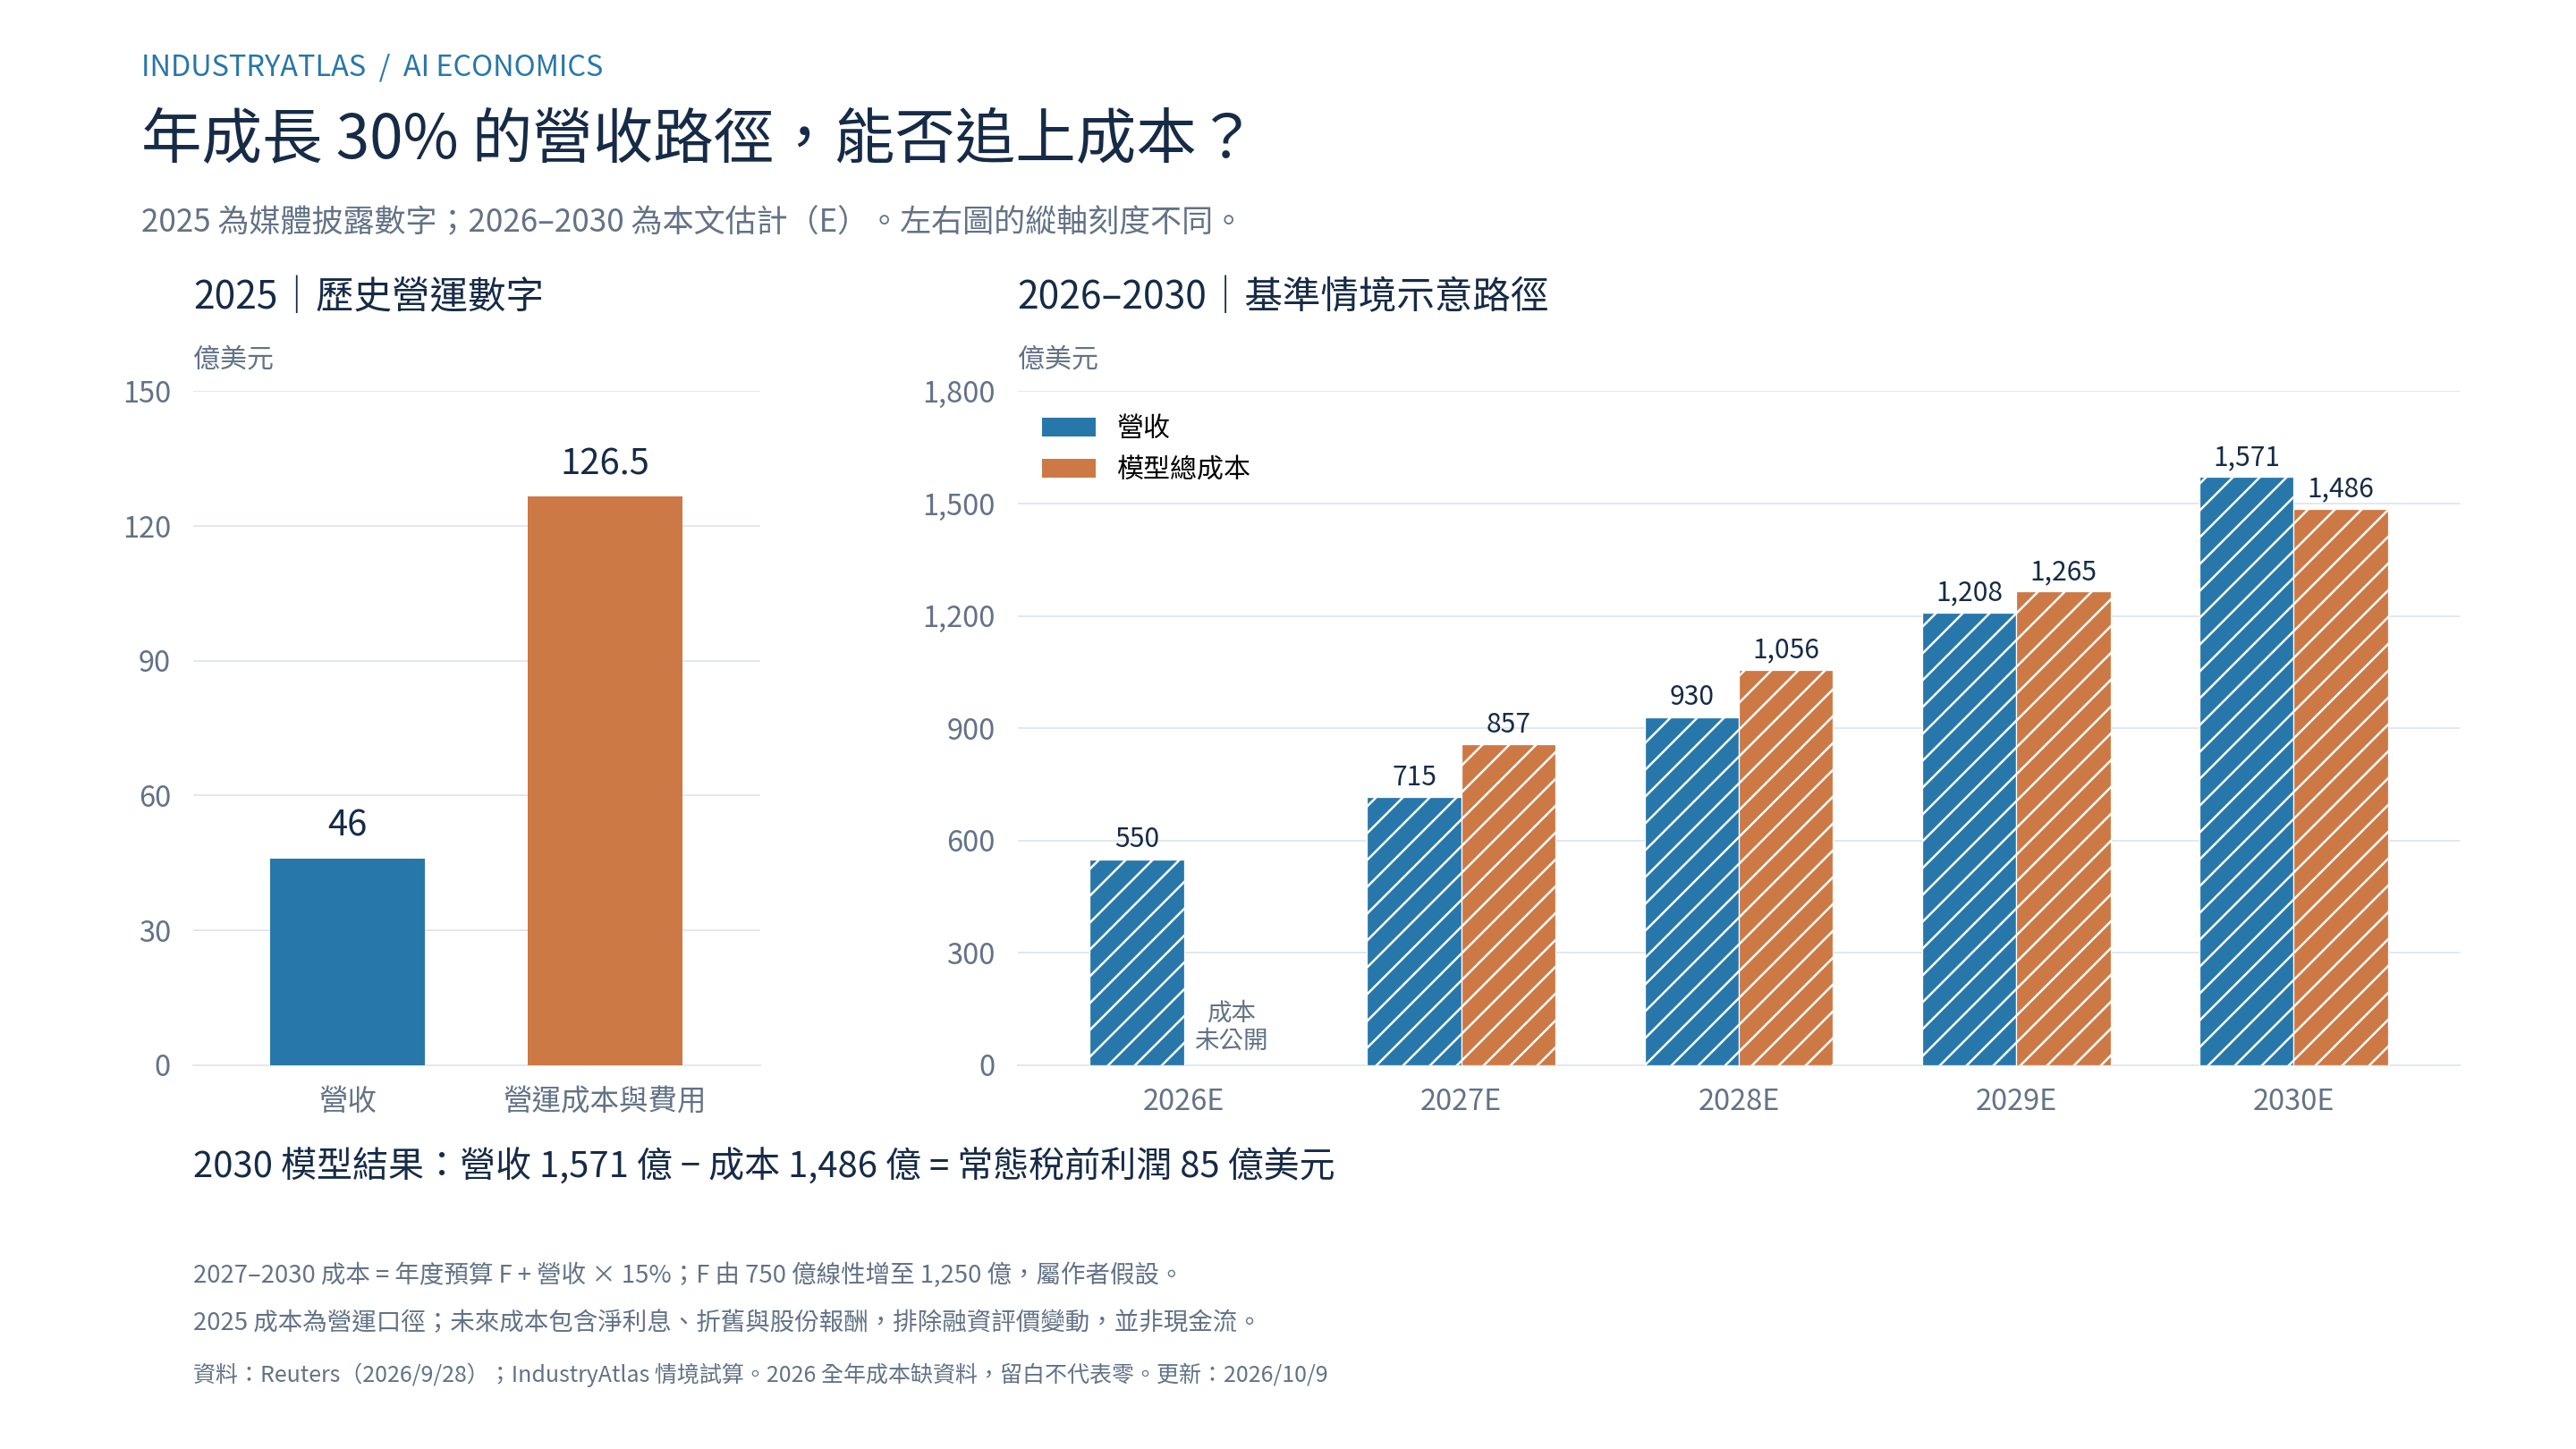
Figure 2: The two panels use different scales. The 2025 costs are operating costs, while future modeled costs also include net interest and other items. They cannot directly establish cost growth on a consistent basis. E denotes the author’s estimates. The original chart is expressed in units of US$100 million; the table below converts amounts to US$ billions.
| Year | Revenue, US$bn | Total modeled costs, US$bn | Normalized pretax profit / loss, US$bn | Nature of the data |
|---|---|---|---|---|
| 2026E | 55.0 | — | — | Author’s full-year revenue estimate; complete cost data unavailable |
| 2027E | 71.5 | 85.7 | −14.2 | 30% annual growth; illustrative cost budget |
| 2028E | 93.0 | 105.6 | −12.7 | Same assumptions |
| 2029E | 120.8 | 126.5 | −5.6 | Same assumptions |
| 2030E | 157.1 | 148.6 | +8.5 | Base-case endpoint |
Each displayed figure is rounded independently; calculations use unrounded values. Cumulative normalized pretax losses in 2027–2029 are about $32.5 billion, but this cannot directly be treated as the funding requirement. Actual financing needs also depend on noncash items, capital expenditure, prepayments, working capital, and debt principal.
The chart illustrates that even if the company becomes profitable at the endpoint, it must still be able to finance the intervening years of expansion. Breakeven at the destination and sufficient cash along the way require separate verification.
What Investors Should Check in the Next Financial Report
Rather than asking only whether growth looks impressive, investors can use the following framework to check whether revenue quality, expenses, and funding needs are improving together.
| Check | Where to look in the statements or notes | Evidence of reduced risk | Changes that warrant closer attention |
|---|---|---|---|
| Is revenue being realized? | Quarterly/annual revenue and recognition policies | Realized revenue supports earlier run rates on a consistent basis | Higher run rates but lagging full-year revenue; changes between gross and net recognition |
| Is demand durable? | Customer concentration, renewals, usage, and contractual commitments | Repeat payments from unrelated customers and revenue growth after discounts | Growth depends on a few customers, free credits, or short promotions |
| Is usage profitable? | Inference, cloud, channel, and training costs | Incremental usage after price cuts still improves fully burdened profitability | Token usage rises while realized revenue or unit contribution deteriorates |
| Will compute capacity be used? | Purchase commitments, capacity commissioning, impairment, and cancellation charges | Online capacity matches paying demand | Minimum payment obligations rise while revenue or utilization falls short of plans |
| Is adjusted profitability credible? | GAAP/non-GAAP reconciliations and stock-based compensation | Narrower adjustment gaps and controlled diluted share counts | Repeated exclusion of normal operating expenses; rising stock compensation and dilution |
| Does growth turn into cash? | Receivables, operating cash flow, and deferred revenue | Collections keep pace with revenue and operating cash flow improves | Receivables grow faster than revenue and collection periods lengthen |
| Can funding cover the expansion period? | Available and restricted cash, leases, and debt maturity schedules | Future payments are supported by accessible funds | Dependence on unfinished fundraising; more near-term maturities or acceleration provisions |
| Does the share price already assume success? | Diluted valuation, cash-flow forecasts, and returns | More conservative growth and margins still support valuation | Valuation requires sustained high growth, high margins, and low dilution |
The cash review should map payments and funding over at least the next 12–24 months, including minimum purchase payments, cash operating expenses, capital expenditure, interest, and maturing principal. Eliminate overlaps before comparing these with available cash and drawable facilities. Restricted cash and uncommitted future fundraising should not be treated as freely available funds.
The $65 billion fundraising announced in May 2026 helps support expansion, but the amount raised is neither the cash balance on the review date nor operating revenue.[15] Funding resilience still needs confirmation from the latest balance sheet and cash-flow statement.
That round valued the company at $965 billion post-money.[15] Even under this article’s 30% annual growth path, this represents approximately 6.1 times 2030 revenue, while the base-case normalized pretax margin is only about 5.4%. The ratio uses the equity valuation at that time, not enterprise value, and does not reflect subsequent dilution or discounting. It highlights the considerable gap between eventually reaching breakeven and justifying today’s investment price.
Another potential positive that can be overstated is rising memory prices. If assets continue to be depreciated at historical cost, higher spot prices do not automatically reduce depreciation; new equipment purchases and contract renewals may instead become more expensive. Even if revised useful lives lower current expenses, equipment replacement needs and cash outlays must be checked separately. This cannot automatically be treated as an improvement in the business model.
Which Figures Would Change Our Assessment?
With base-case cost assumptions unchanged, different growth rates produce the following outcomes:
| Revenue CAGR, 2026–2030 | 2030 revenue, US$bn | Base-case normalized pretax profit / loss, US$bn |
|---|---|---|
| 20% | 114.0 | −28.1 |
| 25% | 134.3 | −10.9 |
| 30% | 157.1 | +8.5 |
| 35% | 182.7 | +30.3 |
| 40% | 211.3 | +54.6 |
If future revenue falls materially below this path while new compute commitments keep rising, the assessment should move toward the cost-pressure scenario. Conversely, a lower fully burdened cost ratio, better collections, and no matching increase in noncancelable obligations would support a shift toward the efficiency-improvement scenario.
The starting point also needs updating. If full-year 2026 revenue ends at only $50 billion, the base-case required CAGR rises to about 31%; at $60 billion, it falls to about 25%. Revenue news cannot be updated while the model’s old growth threshold is left unchanged.
Whenever new full-year figures become available, investors can recalculate:
Remaining required CAGR = [updated 2030 breakeven revenue ÷ latest realized full-year revenue]^(1 / remaining years) − 1
Quarterly data should first be distinguished from full-year estimates or trailing-twelve-month revenue. Simply multiplying one quarter by four and mixing it with realized annual figures should be avoided. Costs also need updating because new procurement, financing, or pricing terms can change the breakeven target.
Under the current Anthropic assumptions, our focus is on whether medium-term revenue growth of approximately 30%–35% can coincide with cost discipline, stronger collections, and better cash flow. Growth below that range alongside continuing upward cost revisions would raise business-model and financing risks. Even growth within the range could leave equity prices in bubble territory if valuations require faster growth for longer. This range is conditional on the model, not a universal profitability standard for AI companies.
Returning to the OpenAI news, $50 billion is a positive indication that revenue continues to expand. It is below the earlier circulating figure and may still represent very strong commercialization progress. Both can be true.
IndustryAtlas remains cautiously optimistic about demand and revenue, while awaiting financial evidence before concluding that breakeven can arrive earlier. Better fully burdened margins, collections that keep pace with revenue, and controlled additional compute commitments would provide stronger grounds for raising the earnings outlook. Whether shareholders earn adequate returns also depends on valuation, financing, and dilution.
Model Definitions and Limitations
- Cost classification: Compute costs include training, inference, related infrastructure operations, and accrued depreciation/lease expenses. Other costs include cash compensation, non-compute R&D, administration, non-channel marketing, and net interest. Stock-based compensation and channel fees appear only in v to avoid double counting. - F is not permanently fixed: It is the annual budget assumed for each scenario. Compute costs also vary with usage. If revenue scale, model architecture, or pricing moves beyond the scenario’s scope, F must be re-estimated. The table’s 1 − v must not be treated as an actual gross margin. - Separate earnings from cash: Asset purchases, prepayments, and debt principal are not all charged directly to current-period expenses. Related depreciation, amortization, and interest are included according to the model’s definitions. The model therefore cannot determine when cash will run out or the probability of default. - Scenarios are not statistical intervals: The 16%, 28%, and 40% figures are thresholds under three sets of conditions, not probability forecasts or confidence intervals. Without full contracts and audited financial data, substantial uncertainty remains around the cost path.
Sources & notes
- Sources are listed below with publication dates. Company announcements and supplier filings are primary sources. Where company financial or confidential-prospectus details come from media reports, this is identified in the text. The article does not treat those reports as a complete S-1 independently reviewed by the author.
- 1. Financial Times: OpenAI annualised revenues $20bn less than previously signalled — October 8, 2026
- 2. Reuters: OpenAI’s September annualized revenue nears $50 billion, less than previously indicated — October 8, 2026
- 3. OpenAI CFO Sarah Friar: A business that scales with the value of intelligence — January 18, 2026
- 4. Financial Times: The hazy OpenAI growth metric driving Wall Street — October 9, 2026
- 5. Bloomberg: OpenAI Expects $70 Billion in Annualized Revenue by End of 2026 — October 9, 2026; republished by Yahoo Finance
- 6. Anthropic: Confidentially submits draft S-1 to the SEC — June 1, 2026
- 7. Reuters: Anthropic’s IPO prospectus shows sweeping AI vision, surging costs — September 28, 2026; republished by Investing.com
- 8. Reuters: Anthropic nears first quarterly profit — May 20, 2026; distinguish Q1 revenue from the Q2 forecast
- 9. Financial Times: Is Anthropic losing its Oura? — September 30, 2026; includes Q2 revenue information
- 10. Reuters: Anthropic revenue run rate tops $65 billion, source says — August 17, 2026
- 11. Reuters citing the Financial Times: Anthropic tells investors it will be profitable for second straight quarter — September 13, 2026
- 12. Reuters: Anthropic’s $518 billion AI buildout hinges largely on deals that cannot be canceled — September 29, 2026; republished by Investing.com
- 13. Reuters: Broadcom to lend Anthropic up to $42 billion to lease its chips, filing says — October 1, 2026
- 14. Akamai: SEC Form 8-K — September 2026; amounts, durations, and terms of Anthropic Project Plans 2 and 3
- 15. Anthropic: Series H funding announcement — May 28, 2026