
INDUSTRY ANALYSIS
Slower Smartphone Demand, More Expensive Components: Prices, Inventory, and Brand Exposure Across the Supply Chain
The 2026 smartphone market faces rising memory prices, a shrinking supply of low-cost handsets, and pressure on consumers’ purchasing power. The impact varies across the supply chain: some suppliers can raise prices, while others face fewer orders. This article reviews pricing trends and disclosed brand relationships, using Longcheer, FocalTech, and Sensortek to distinguish revenue trends, inventory changes, and actual risks.
The most notable contradiction in this year’s smartphone supply chain is that handset shipments are falling while some component prices continue to rise. To preserve profitability, brands may raise retail prices, reduce memory capacity, or withdraw low-cost products that are no longer economical. For suppliers dependent on shipment volumes, a smaller market may gradually affect orders and inventory.[2][4]
Identifying potentially affected companies therefore requires three questions: which price segments do they supply, can they pass on costs, and can non-smartphone businesses fill the gap? Revenue that has not yet declined, or an inventory increase in a single quarter, is insufficient to draw a conclusion.
Global smartphone shipments have weakened markedly; full-year forecasts still need fourth-quarter confirmation
As of the article’s information cutoff, IDC and Counterpoint both forecast double-digit declines in full-year shipments. Counterpoint’s latest preliminary third-quarter data also indicate that second-half pressures have emerged.[1][2][3]
| Source and publication date | Period | Published result | Type of information |
|---|---|---|---|
| IDC, August 26, 2026 | Full year 2026 | Global smartphone shipments forecast to decline 16.7% year over year | Full-year forecast |
| Counterpoint, August 22, 2026 | Full year 2026 | Global smartphone shipments forecast to decline 14.3% year over year | Full-year forecast |
| Counterpoint, October 12, 2026 | Third quarter 2026 | Preliminary global shipments down 20% year over year, which the firm said was close to expectations | Preliminary quarterly estimate |
The third-quarter result is consistent with a weakening market, but one quarter’s decline cannot establish whether a full-year forecast has been met or missed. Fourth-quarter data are still needed, using a consistent source and methodology.
These shipment figures primarily measure brands’ deliveries into distribution channels—sell-in—rather than consumers’ actual purchases, or sell-through. Falling shipments can reflect weaker purchasing, supply constraints, brands deliberately reducing low-margin models, and channel inventory adjustments. Counterpoint reported greater third-quarter pressure in price-sensitive markets: OPPO and vivo shipments each fell more than 20% year over year, while Xiaomi reduced some low-cost products and exposure to non-core markets.[3]
Diverging prices: memory remains firm, while other components cannot all be assumed to be getting cheaper
Memory is a major source of cost pressure. TrendForce’s late-September outlook for the fourth quarter projected continued Mobile DRAM price increases, albeit at a moderating pace. For eMMC / UFS, smartphone brands were producing from existing inventories with limited new procurement.[4]
Strong upstream pricing and weaker downstream orders can therefore coexist. Memory suppliers may benefit from pricing and server demand, but smartphone customers’ reductions in purchased capacity, product mix, and cost changes still affect profitability. Price increases alone cannot establish the scale of earnings growth.
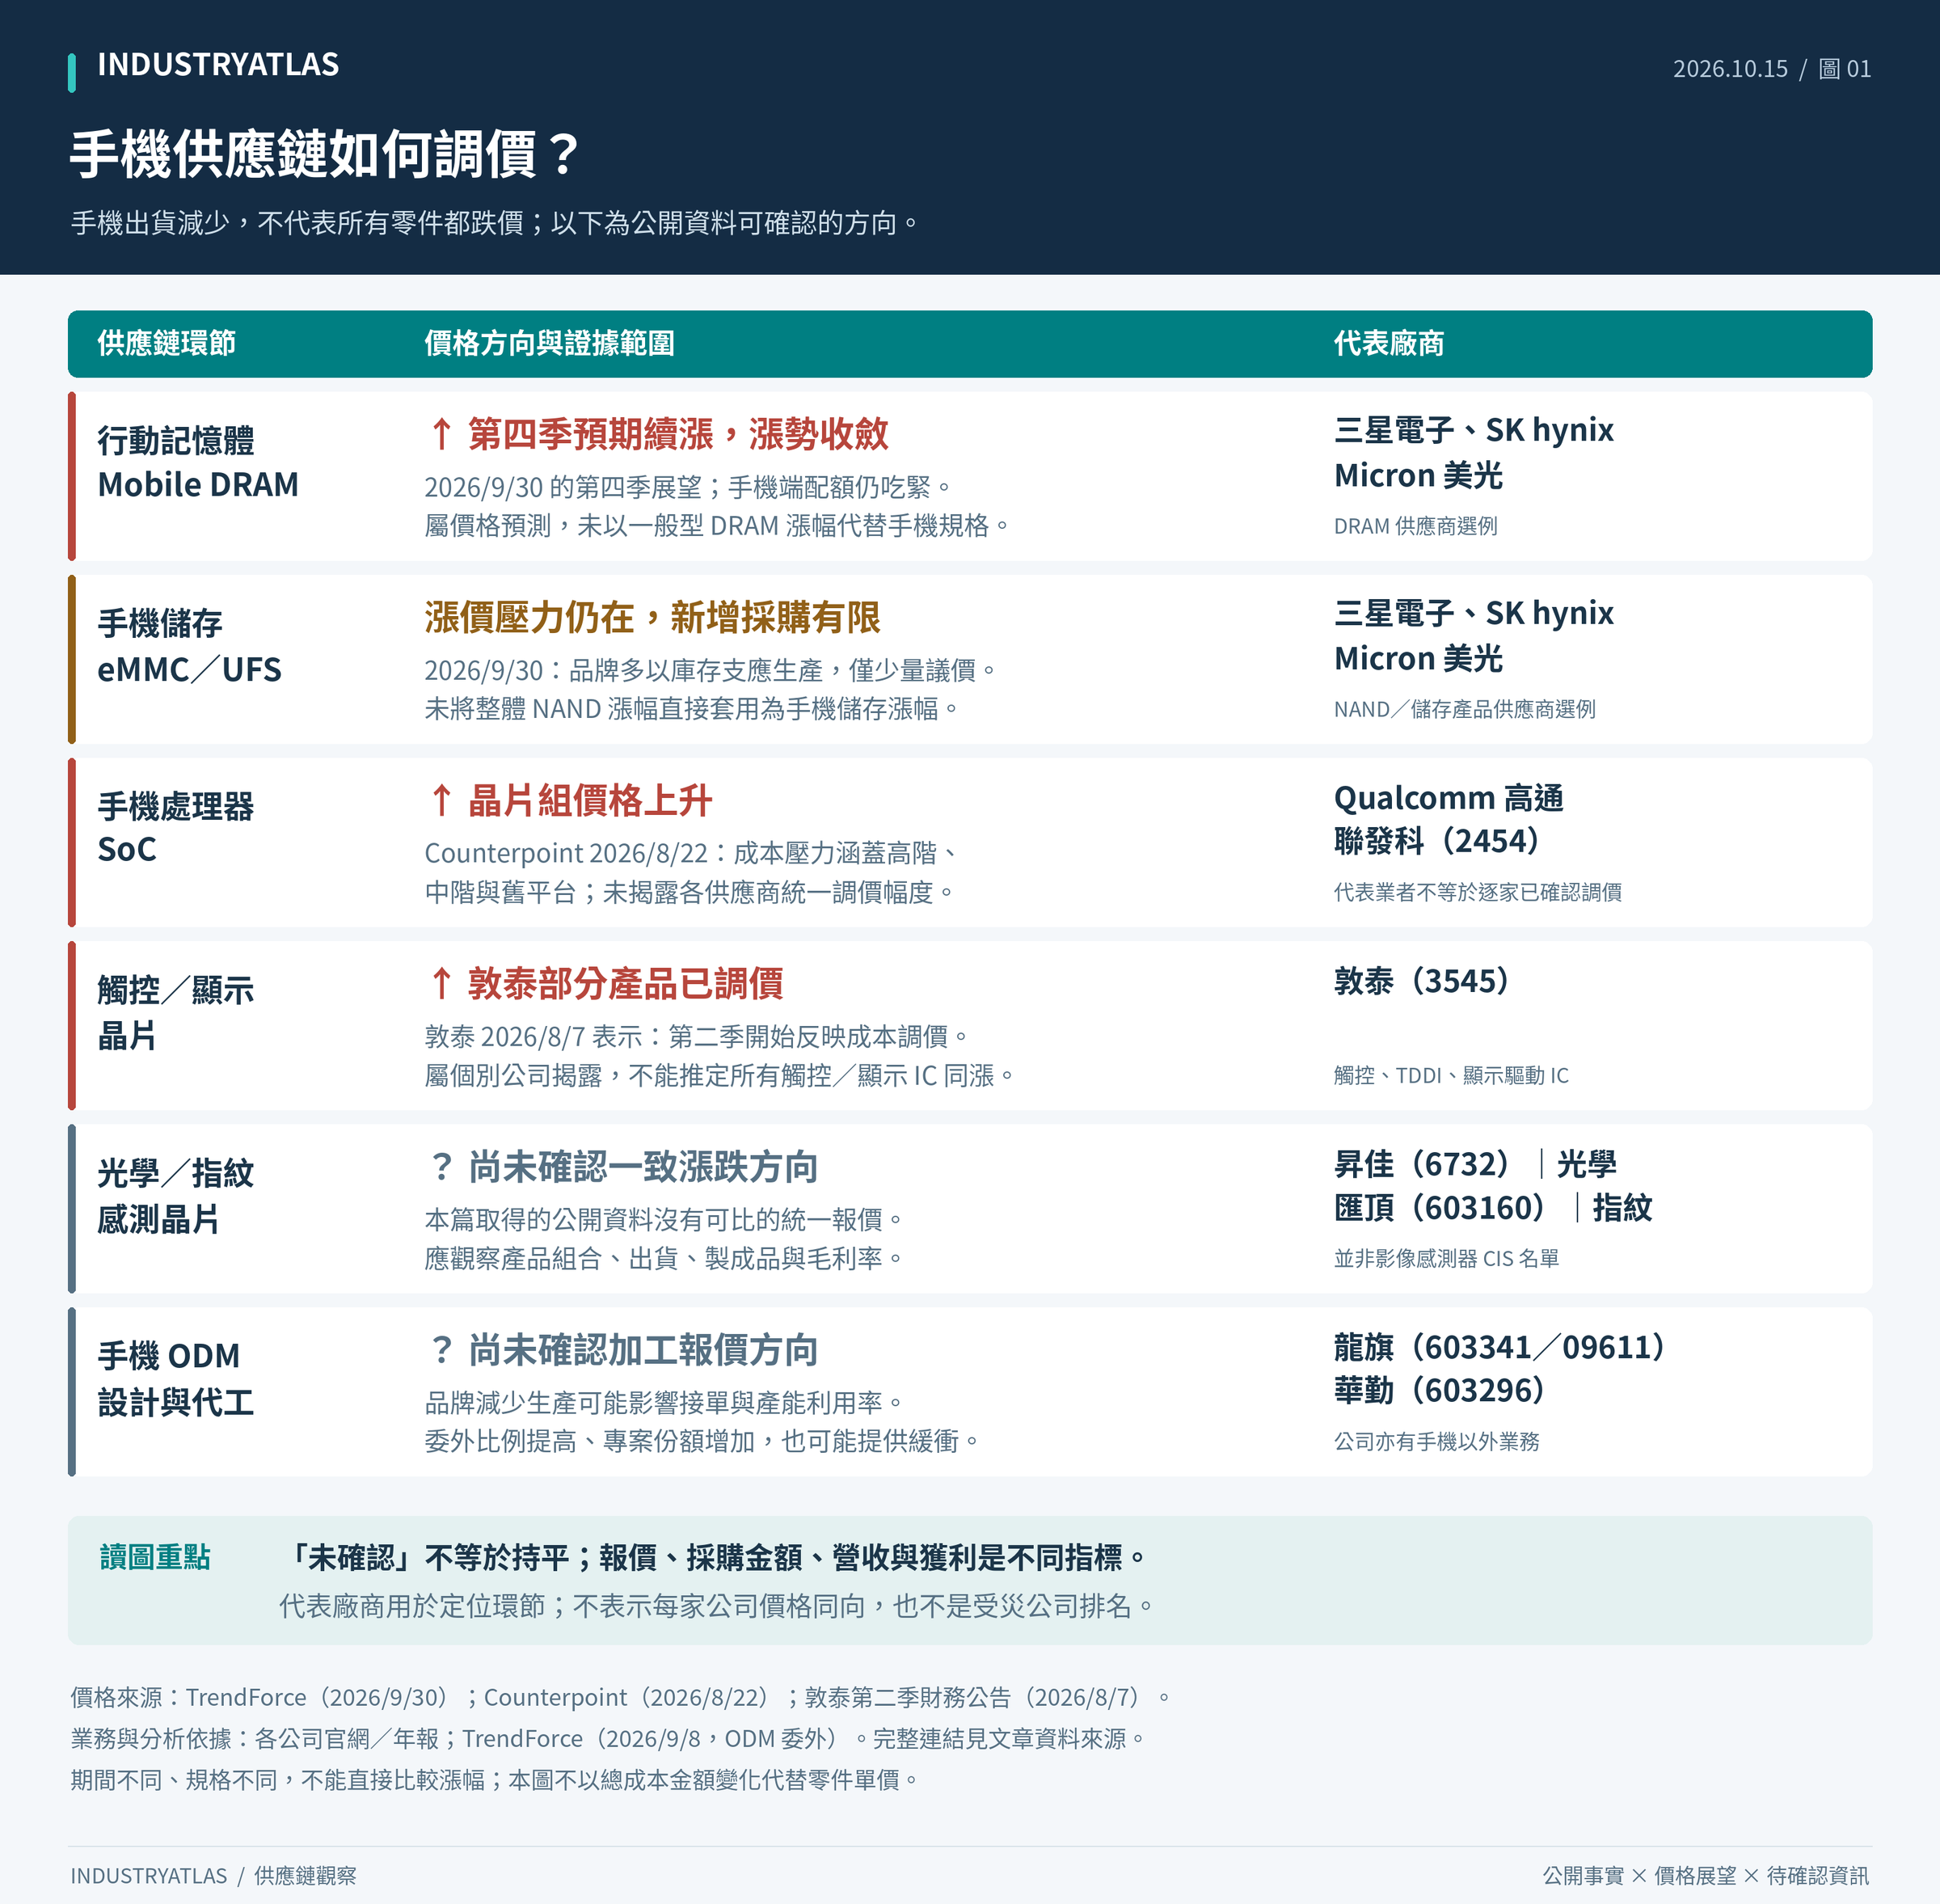
*Figure 1 | Publicly verifiable pricing directions as of October 15, 2026. Fourth-quarter figures are outlooks; FocalTech’s price adjustments are company-specific disclosures for the second quarter. The rows do not compare quotations for identical specifications and periods. Representative suppliers identify industry segments, not a common pricing strategy across all companies. Sources: [2][4][5][10][11][13][16].*
The chart distinguishes three types of evidence. The first is research firms’ assessment of market pricing, such as Mobile DRAM and smartphone chipsets. The second is actual pricing action by an individual company: FocalTech said it began raising prices on some products in the second quarter to reflect higher costs. The third concerns segments without comparable public quotations, such as the sensor chips and ODM services examined here. Weaker smartphone demand alone does not justify labeling those segments as experiencing price declines.[2][4][5]
FocalTech offers another caution. Its second-quarter revenue fell 9.7% year over year, mainly because of lower smartphone sales, according to the company. Even after some price increases, gross margin fell 0.7 percentage points sequentially because of product-mix changes. Whether price increases improve profitability also depends on costs, shipment volumes, and product mix.[5]
Lower component procurement spending or cost of goods sold does not necessarily mean lower component unit prices. Fewer units, lower specifications, or a different mix can all reduce total spending. Aggregate amounts reported by different companies cannot be converted directly into component-price declines.
Which supply-chain segments deserve priority attention?
Structurally, suppliers heavily dependent on low- and midrange smartphones, with little pricing flexibility and insufficient support from other businesses, may be more exposed to falling volumes. Public disclosures rarely provide complete revenue breakdowns by handset price segment, so the following is a screening framework, not a confirmed ranking of the hardest-hit companies.
| Segment | How pressure may spread | Potential offsets to examine |
|---|---|---|
| Smartphone ODM / contract manufacturing | Brands cut models and production plans, affecting orders, capacity utilization, and fixed-cost absorption | Higher outsourcing rates, additional projects, and realized growth in non-smartphone revenue |
| Touch / display ICs | Reduced purchasing of handset panels and finished phones, or customers cutting other component costs | Price adjustments, new design wins, AMOLED, automotive, industrial, and repair-market demand |
| Optical, proximity, and fingerprint sensor ICs | Lower production of models using the chips may reduce demand or delay deliveries | Changes in chips per device, specification upgrades, supply share, and other applications |
Smartphone contract manufacturing cannot be assessed solely from the overall market decline. TrendForce reported in September that Samsung was increasing ODM use for low- and midrange phones to reduce costs. A higher outsourcing rate could allow ODMs to gain share and offset some of the market contraction.[17]
Claims that a company has “no AI business to compensate” also require verification. Huaqin’s official business portfolio includes servers, and Longcheer has initiatives including AI PCs. For these companies, the relevant question is whether recognized revenue and gross profit from new businesses can offset smartphone declines. Product plans cannot be treated as profits, nor should the entire company be regarded as a pure smartphone supplier.[11][16]
The display supply chain also serves repairs and used devices. In August, TrendForce forecast a 2.5% decline in 2026 smartphone-panel shipments, supported by repair and secondary-market demand. That measure differs from new-handset shipments and shows why component demand need not move proportionately with finished-device shipments.[18]
Why revenue may reflect demand changes with a lag
“Weaker end demand first, slower brand purchasing later” is a plausible transmission path with public industry-level evidence. Omdia’s first-quarter report described advance purchasing ahead of expected price increases and a gap between shipments and end sales. In August, Counterpoint said channel inventory had increased for some brands and markets in the first half, with weaker end sales expected to affect second-half production orders.[2][6]
Suppliers may still be fulfilling earlier orders during this process. Higher prices and a larger share of higher-value products can also support revenue. The pressure becomes clearer in subsequent figures as brands work through inventory, revise new-product plans, or postpone deliveries.
This timing gap needs verification for each company. Monthly revenue should be considered alongside order visibility, inventory composition, and gross margin. A single unusual indicator still allows for alternative explanations.
Separate raw-material stocking from finished-goods accumulation
Longcheer provides an example. In the first half of 2026, smartphone revenue fell 11.43% year over year, while the carrying value of inventory at the end of June rose approximately 46.8% from year-end. Within that total, raw materials rose about 59.5%, while goods held for sale fell approximately 20.9%. The company said it increased material stocking in response to rising material prices and production requirements.[7]
The inventory increase therefore cannot simply be interpreted as “phones manufactured but unable to sell.” Whether the stocking was appropriate depends on subsequent material consumption, procurement prices, and orders. If future demand falls short, previously reasonable stocking can still become a burden.
A more informative assessment checks three things together:
1. Where inventory is growing: whether raw materials, work in progress, and finished goods are moving differently. 2. Whether turnover is slowing: average inventory divided by cost of goods sold for the same period, multiplied by the period’s days. Prefer year-over-year quarterly comparisons and account for seasonality and raw-material inflation. 3. Whether inventory can be realized normally: whether aging, write-downs, delayed customer acceptance, and operating cash flow are deteriorating together.
An increase in inventory value alone is incomplete evidence. Persistent growth in finished goods, longer turnover, and simultaneous declines in shipments and gross margin would warrant closer investigation.
Sensortek: a higher finished-goods share merits attention, but does not establish a risk
Sensortek’s second-quarter statements show total inventory of approximately NT$632 million at the end of June 2026, up about 1.4% year over year—not a large overall increase. The composition, however, changed considerably.[8]
| Inventory item, NT$ million | June 30, 2025 | June 30, 2026 | Year-over-year change |
|---|---|---|---|
| Raw materials | 116.980 | 87.153 | -25.5% |
| Work in progress | 370.098 | 282.608 | -23.6% |
| Finished goods | 136.011 | 262.187 | +92.8% |
| Total inventory | 623.089 | 631.948 | +1.4% |
*Source: inventory note in Sensortek’s second-quarter 2026 financial statements. Changes are calculated from the original figures and rounded. Both columns refer to the end of June, avoiding a direct comparison between year-start and peak-season stocking dates.[8]*
Finished goods rose from approximately 21.8% to 41.5% of total inventory. Meanwhile, first-half inventory write-down and obsolescence losses were NT$11.834 million, versus NT$11.977 million a year earlier, and did not rise alongside that share. The company’s reported revenue for the first nine months declined 13.75% year over year. This covers a different period from the June-end inventory figures and cannot be treated as a change within the same quarter.[8][9]
The established facts are weaker revenue and a rising finished-goods share. Current information is insufficient to determine whether finished goods are slow-moving or whether particular brands have cut orders. Product transitions, stocking, and delivery schedules can all affect inventory composition. These are possible explanations requiring verification, not company-confirmed causes. Subsequent finished-goods depletion, inventory aging, and write-downs deserve continued attention.
Sensortek’s annual report also discusses high-end and flagship devices, so it should not be classified directly as a purely low- and midrange smartphone supplier.[10]
Disclosed brand relationships help establish a watchlist after production cuts
Relationships with Samsung, Xiaomi, OPPO, and vivo can be cross-checked through supplier websites, annual reports, specific product announcements, and brand supplier lists. Disclosure depth varies: some sources establish only a customer relationship, some identify smartphone products, and a smaller number specify models.
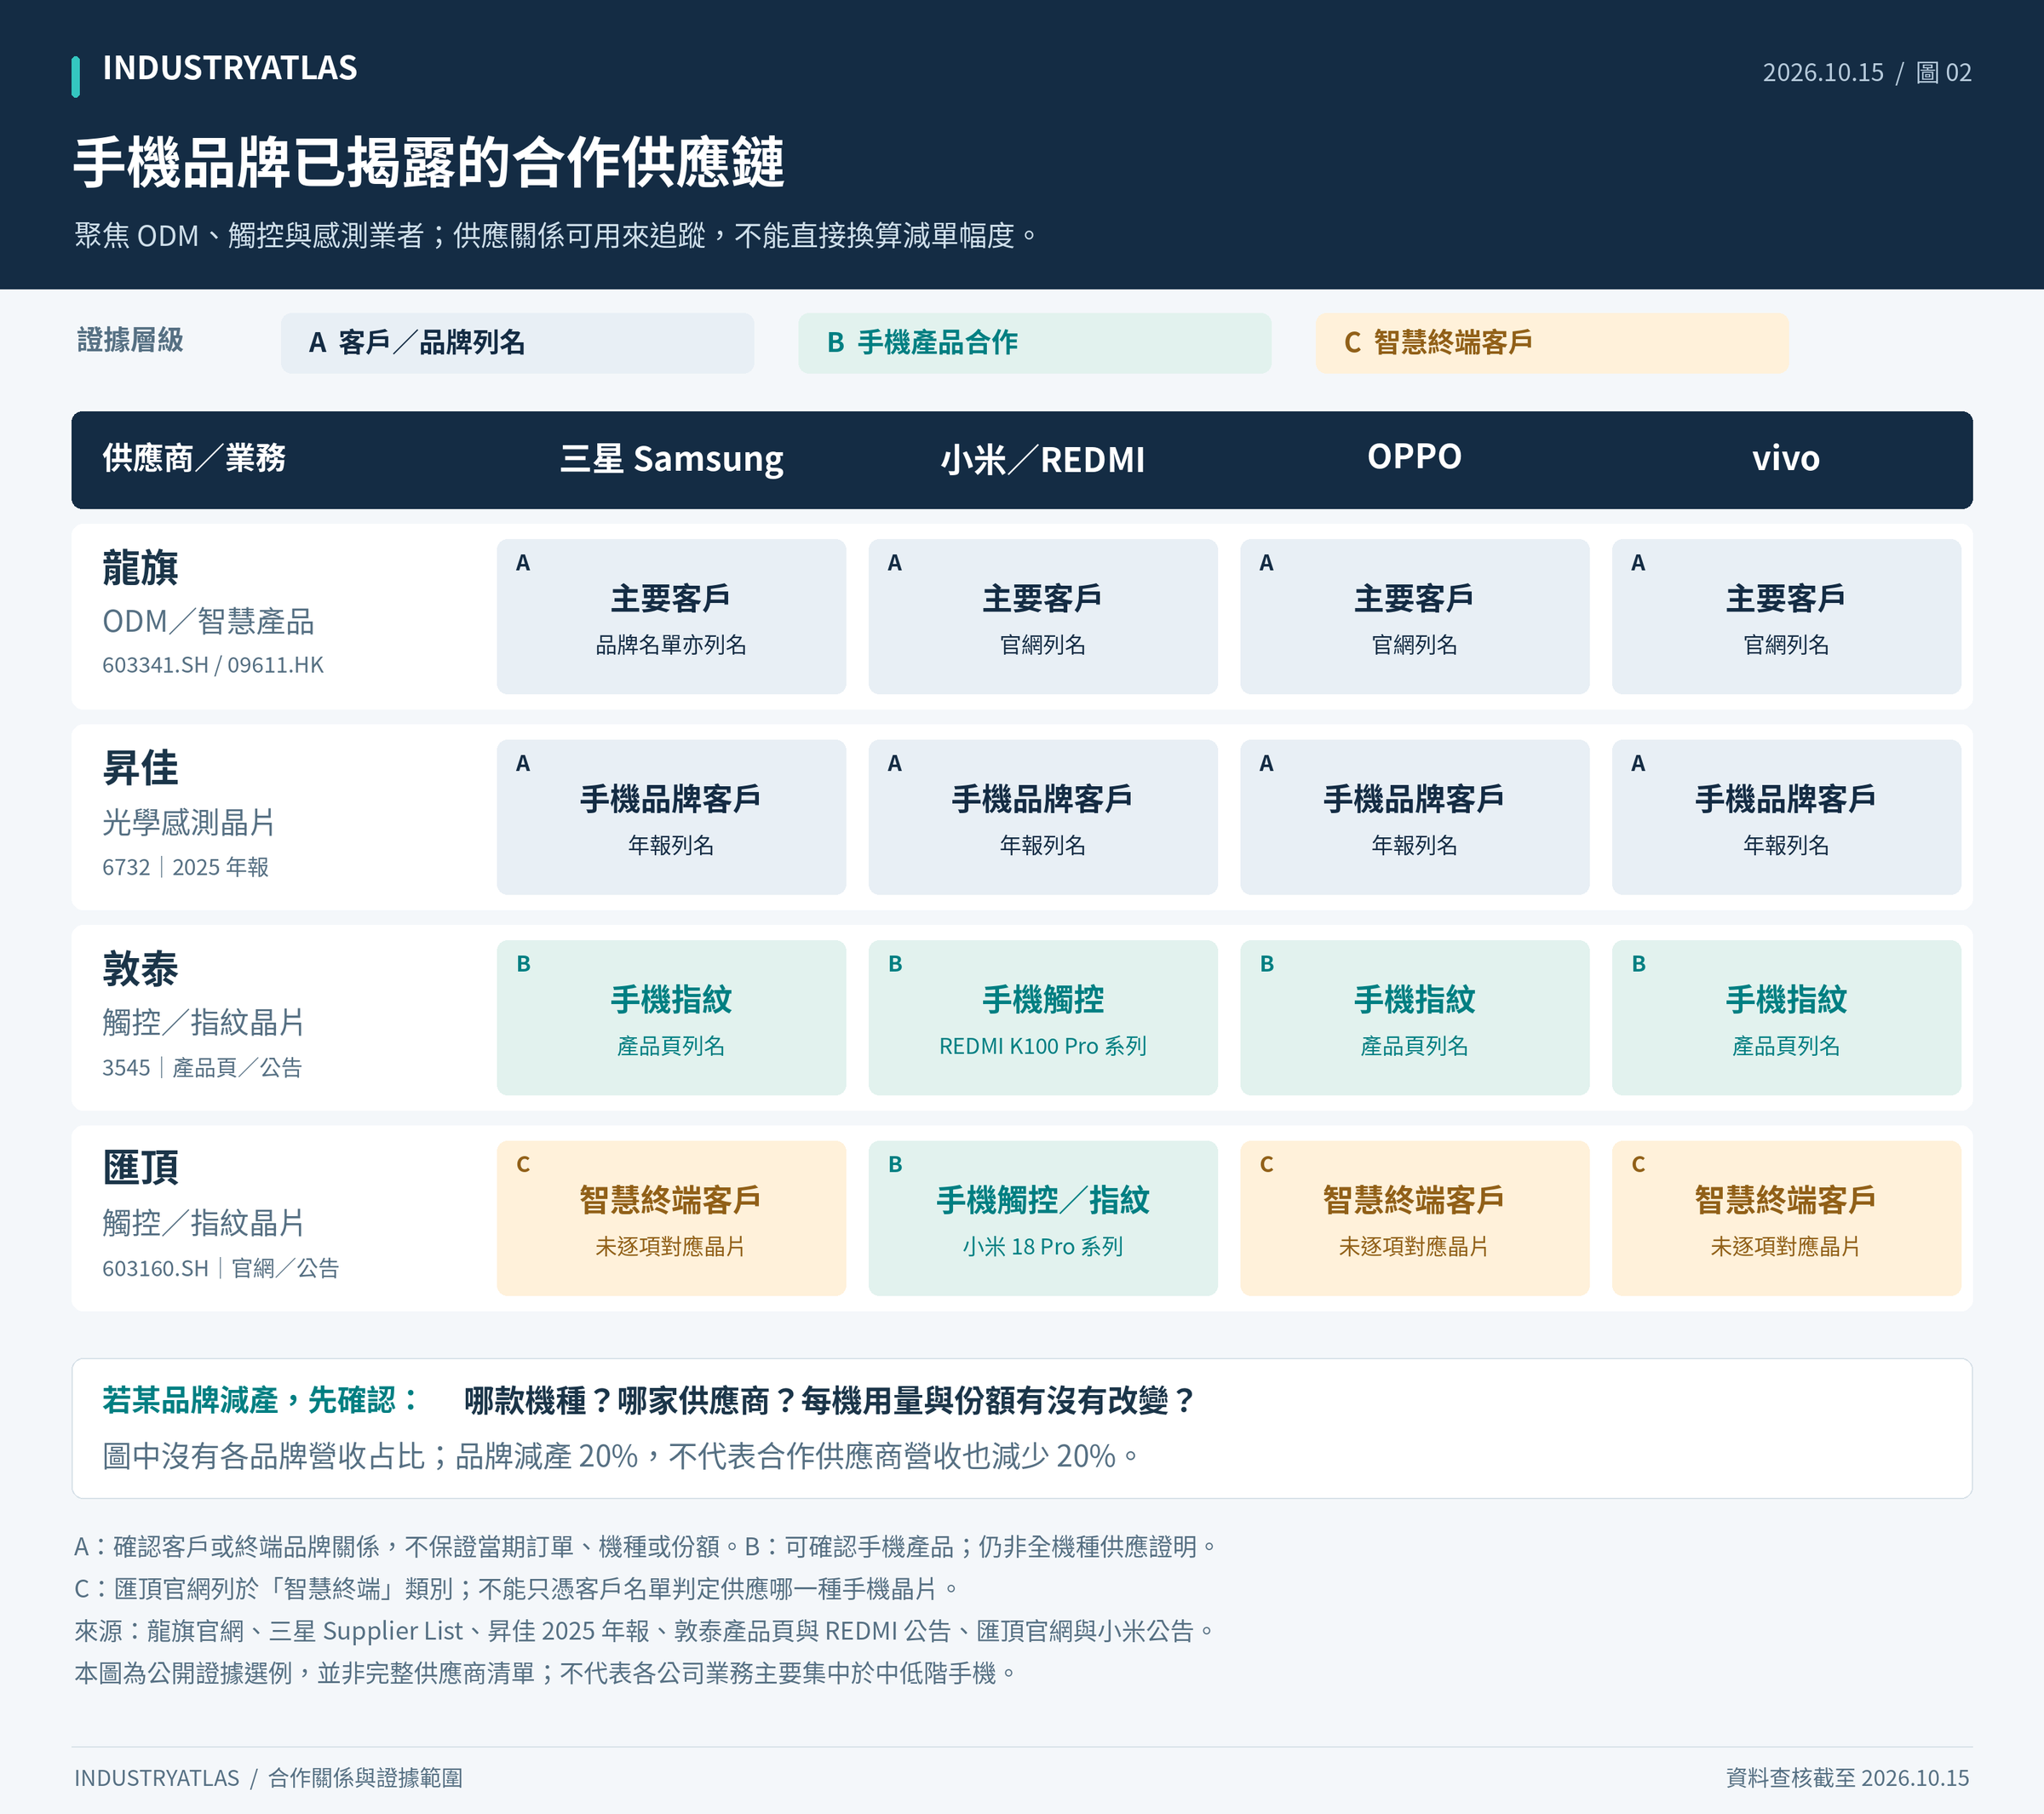
*Figure 2 | Examples of verifiable relationships as of October 15, 2026 among the ODM, touch, and sensor suppliers examined here. This is a selection of public evidence, not a complete supplier list. A brand name does not identify a particular price segment, current procurement volume, or revenue share.[10][11][12][13][14][15][19]*
| Supplier | Disclosed brands and scope | What can be concluded |
|---|---|---|
| Longcheer | Its website names Samsung, Xiaomi, OPPO, and vivo as major customers; Samsung’s list also includes Nanchang Longcheer | Customer / supplier relationships are established, but current smartphone order shares by brand cannot be inferred |
| Sensortek | Its 2025 annual report explicitly names non-Apple smartphone brands including Samsung, Xiaomi, OPPO, and vivo | End-brand relationships are established; procurement volumes and revenue shares by brand are not disclosed |
| FocalTech | Its smartphone fingerprint page names Samsung, OPPO, and vivo; a separate announcement identifies its touch solution in the REDMI K100 Pro series | Evidence must be matched to products; fingerprint or touch cooperation does not establish display-driver IC supply |
| Goodix | Its smart-device customer list includes all four brands; a separate announcement covers touch and ultrasonic fingerprint products for the Xiaomi 18 Pro series | The customer list does not map each brand to specific chips; model-specific announcements provide stronger evidence |
Direct customers must also be distinguished from end brands. Sensortek’s annual report states that sales to Sitronix represented 46.30% of 2025 revenue. This is a disclosed direct-customer relationship, not a basis for allocating revenue among handset brands. Intragroup transactions between Sitronix and Sensortek must not be counted twice as end demand.[10]
Samsung’s public supplier list covers Samsung Electronics’ overall operations, not only smartphones. Adding other listed companies to a smartphone supply-chain map requires corresponding handset product or project evidence. Similarly, past cooperation or a customer listing does not establish continuing adoption in every current model.[12]
After a brand cuts production, how can the actual impact on suppliers be assessed?
A decline in a brand’s total shipments does not necessarily mean all its suppliers decline together. Analysis should trace the affected models, supplier allocation, content per device, unit prices, and inventory.
For example, suppose a phone model’s production falls 20%, but a supplier’s share rises from 30% to 40%, with unchanged content per device. That supplier’s unit shipments could increase by approximately 6.7%. This is only an arithmetic example, but it illustrates why a brand’s shipment decline cannot be treated directly as a supplier’s revenue decline.
IndustryAtlas perspective
This smartphone downturn centers on rising costs and price-sensitive demand. Priority monitoring should focus on suppliers with high smartphone dependence, limited pricing power, and insufficient contributions from other businesses. Identifying the most affected companies still requires connecting customer relationships with actual products, orders, and inventory.
The market’s shipment weakness is established, as are changes in some suppliers’ revenue or inventory composition. Sensortek’s rising finished-goods share warrants attention, but whether it represents an actual risk depends on subsequent depletion and financial evidence. This supply-chain map is intended to help prioritize monitoring and update assessments as new information becomes available.
Sources & notes
- 1. IDC, August 26, 2026: Smartphone Shipments Set for Record 16.7% Drop in 2026.
- 2. Counterpoint, August 22, 2026: Global Smartphone Market to Fall 14% in 2026.
- 3. Counterpoint, October 12, 2026: Global Smartphone Shipments Hit a New Low with 20% YoY Decline. Preliminary third-quarter sell-in data.
- 4. TrendForce, September 30, 2026: Additional AI-server demand supports 4Q26 memory contract-price increases, while consumer pressure persists. Mobile DRAM and eMMC / UFS sections. Price increases for conventional DRAM or overall NAND cannot be applied directly to every smartphone specification.
- 5. FocalTech, August 7, 2026: Second-quarter 2026 financial results. Price adjustments on selected products, product mix, and inventory health reflect the company’s disclosures / assessment at that time.
- 6. Omdia, April 30, 2026: Global smartphone shipments exceed expectations with 1% growth in 1Q26. Cited for advance purchasing and channel-inventory analysis; its quarterly figures are not spliced together with those of other firms.
- 7. Longcheer: 2026 interim report. Statutory company report reproduced by Sina Finance. Smartphone-segment revenue and inventory notes; inventory items use carrying values, with changes measured from year-end 2025.
- 8. Sensortek: Second-quarter 2026 financial statements. Approved August 4, 2026. PDF page 4: balance sheet; page 20: inventory note.
- 9. Sensortek: Monthly revenue. January–September 2026 data.
- 10. Sensortek: 2025 annual report. Published in 2026. Printed pages 81–82 cover handset brands and product positioning; page 85 covers major customers.
- 11. Longcheer: Company profile and major customers.
- 12. Samsung Electronics: Supplier List. PDF page 3 lists Nanchang Longcheer Information Technology Co., Ltd. among outsourced suppliers. The list covers multiple Samsung Electronics businesses.
- 13. Goodix: Major Clients. Smart Devices category.
- 14. FocalTech: Fingerprint sensor products. Smartphone section.
- 15. FocalTech: REDMI K100 Pro series touch-solution announcement. Dated August 14, 2026 in the official news index; digits in the URL are not used to determine the publication date.
- 16. Huaqin: Company profile. Smartphone, notebook, and server business portfolio.
- 17. TrendForce, September 8, 2026: Early Purchases Lift 2026 Smartphone Production Above Expectations. Cited for Samsung’s higher ODM utilization; its production measure differs from shipments.
- 18. TrendForce, August 31, 2026: Secondary and Repair Markets Provide Support; Global Smartphone Panel Shipments to Decline Just 2.5% in 2026.
- 19. Goodix, September 23, 2026: Xiaomi 18 Pro series cooperation announcement. Touch and ultrasonic fingerprint product cooperation.