INDUSTRY ANALYSIS
Is 200% CAGR for CPO and NPO Plausible? Optical-Module Growth and Market Share Explained
Annual compound growth above 200% for CPO and NPO may initially sound overly optimistic. Yet a small 2025 base, AI-driven optical-module demand, and rising adoption of new architectures provide an industry rationale. Assuming NPO / CPO reaches 60% of the combined market in 2030, this article works backward to the required market growth and identifies what to watch in 2026–2027 production ramps and AI demand in 2028.
Recent optical-communications research and company disclosures have included forecasts of more than 200% compound annual growth for CPO / NPO. Compound annual growth rate, or CAGR, measures the average compounded rate of growth over a period.
A 200% CAGR means an average tripling each year. For a mature industry, that would usually be an aggressive assumption. For a newly commercializing market, however, the assessment must also consider how small the starting point is and how large the addressable market could become.
IndustryAtlas’s view is that available information can explain why NPO / CPO might achieve CAGR above 200%. What still needs verification is whether the architectures can reach production on schedule, gain adoption, and benefit from AI optical-interconnect demand extending beyond 2028.
Start by separating the forecasts above 200%
Several frequently conflated figures need to be distinguished.
| Public source | Forecast | Market scope and underlying source |
|---|---|---|
| CMB International (CMBI), June 12, 2026 | Approximately 219% CPO revenue CAGR during 2025–2030 | Report cites Frost & Sullivan (F&S), presenting a CPO market estimate.[1] |
| TrendForce, June 15, 2026 | NPO / CPO grows from approximately $100 million in 2025 to over $39 billion in 2030 | The endpoints imply approximately 230% CAGR, calculated in this article.[2] |
| Focuslight Technologies, public filing dated August 8, 2026 | NPO / CPO optical engines grow from RMB620 million in 2025 to RMB204.19 billion in 2030, a 218.69% CAGR | The company filing cites F&S optical-engine market data.[3] |
Two cautions matter. First, CMBI and Focuslight both cite F&S: two documents do not represent two research firms independently reaching the same answer. Second, optical engines and the overall NPO / CPO market may have different statistical boundaries. Figures in different currencies and with different scopes cannot be substituted directly for one another.
The more precise statement is therefore that public sources contain high-growth forecasts of approximately 219%–230%, not that the entire optical-communications industry will grow at those rates.
Architecturally, NPO—near-packaged optics—moves optical engines close to switching or compute chips. CPO—co-packaged optics—integrates optics and the main chip within a shared package. Both shorten the high-speed electrical path before conversion to light, but differ in integration and maintenance.[1]
Why are optical transceivers growing?
Optical transceivers convert between electrical and optical signals. Larger AI-server clusters exchange more data, making optical interconnects an important contributor to system performance.
In April 2026, TrendForce estimated that the AI-specific optical-transceiver market would grow from $16.5 billion in 2025 to $26 billion in 2026, approximately 57.6% year over year. That supports an assessment of rapid growth, but 2026 remains a full-year forecast. Two annual figures alone cannot establish continuously accelerating growth.[4]
The demand can be understood in three layers:
1. More equipment and connections. Larger AI clusters require more interconnections between devices. 2. More bandwidth per connection. Upgrades to products such as 800G and 1.6T change shipment mix and optical spending per system. 3. New applications for optical links. If optical solutions enter scale-up connections previously served mainly by copper, they add demand beyond the existing optical market.
The first two explain expansion in the established optical-module market; the third is important to long-term NPO / CPO forecasts. Coherent’s March 2026 investor presentation also identified optical replacement of copper in scale-up as a source of addressable-market expansion.[5]
Revenue growth must not be equated directly with module-unit growth. Product upgrades, selling prices, and content per system all affect revenue. Tracking both shipments and product mix is necessary.
How small was the NPO / CPO base in 2025?
The model below uses TrendForce’s approximately $100 million in 2025 as the NPO / CPO starting point.[2]
For scale, the AI optical-transceiver market cited above was $16.5 billion—approximately 165 times larger. This is not a market-share calculation with perfectly aligned definitions, but it illustrates that NPO / CPO’s high growth starts from a small, early-commercialization base.
Starting at $100 million gives the following five-year outcomes:
| CAGR, 2025–2030 | NPO / CPO market in 2030 | Calculation, $ billion |
|---|---|---|
| 200% | $24.3 billion | 0.1 × 3⁵ |
| Approximately 229.8% | $39 billion | 0.1 × 3.2977⁵ |
“Achieving 200% CAGR” and “reaching $39 billion” are therefore different thresholds. The latter requires a higher growth rate.
CAGR is also an average between endpoints, not a prediction that every year will triple. The actual path may begin with qualification and limited shipments, followed by rapid expansion as major platforms adopt the technology.
With a 60% NPO / CPO share, how much must the optical-interconnect market grow?
To assess whether $39 billion is a plausible scale, work backward: if NPO / CPO represents 60% of the combined market in 2030, how large must that market be?
Here, the combined market means revenue from pluggable optical modules plus NPO / CPO. The 60% figure is an assumed 2030 revenue share, not a unit-shipment share or GPU adoption rate.
> Combined 2030 market = $39 billion ÷ 60% = $65 billion. > > NPO / CPO contributes $39 billion, leaving $26 billion for the remainder.
This decomposition matches the scale of TrendForce’s same forecast: NPO / CPO above $39 billion and pluggable modules near $26 billion. This article uses rounded values of $39 billion and $26 billion to construct the scenario; 60% is not independent validation.[2]
Next, use the AI optical-transceiver estimates of $16.5 billion for 2025 and $26 billion for 2026 as approximate scale anchors for the combined market and calculate the required growth.
This is an order-of-magnitude exercise across different market scopes. AI-specific optical transceivers and the combined market have not been confirmed to use identical definitions. The calculation answers how quickly a market roughly needs to expand to reach the target; it is not a formal forecast using a consistent statistical scope.
| Comparison | Starting point | 2030 scenario | Required CAGR |
|---|---|---|---|
| Five-year scale estimate for the combined market | $16.5 billion in 2025 | $65 billion | Approximately 31.5% |
| Post-2026 scale estimate for the combined market | $26 billion in 2026 | $65 billion | Approximately 25.7% |
| NPO / CPO | $100 million in 2025 | $39 billion | Approximately 229.8% |
This is the model’s central result: if NPO / CPO reaches a 60% revenue share in 2030, combined-market CAGR of approximately 25.7% after 2026 can support approximately 230% five-year NPO / CPO CAGR in this approximate model.
That requirement is below the forecast 57.6% AI optical-module growth in 2026, meaning the model allows subsequent growth to slow. It does not require the entire market to grow at nearly 200% for five consecutive years.
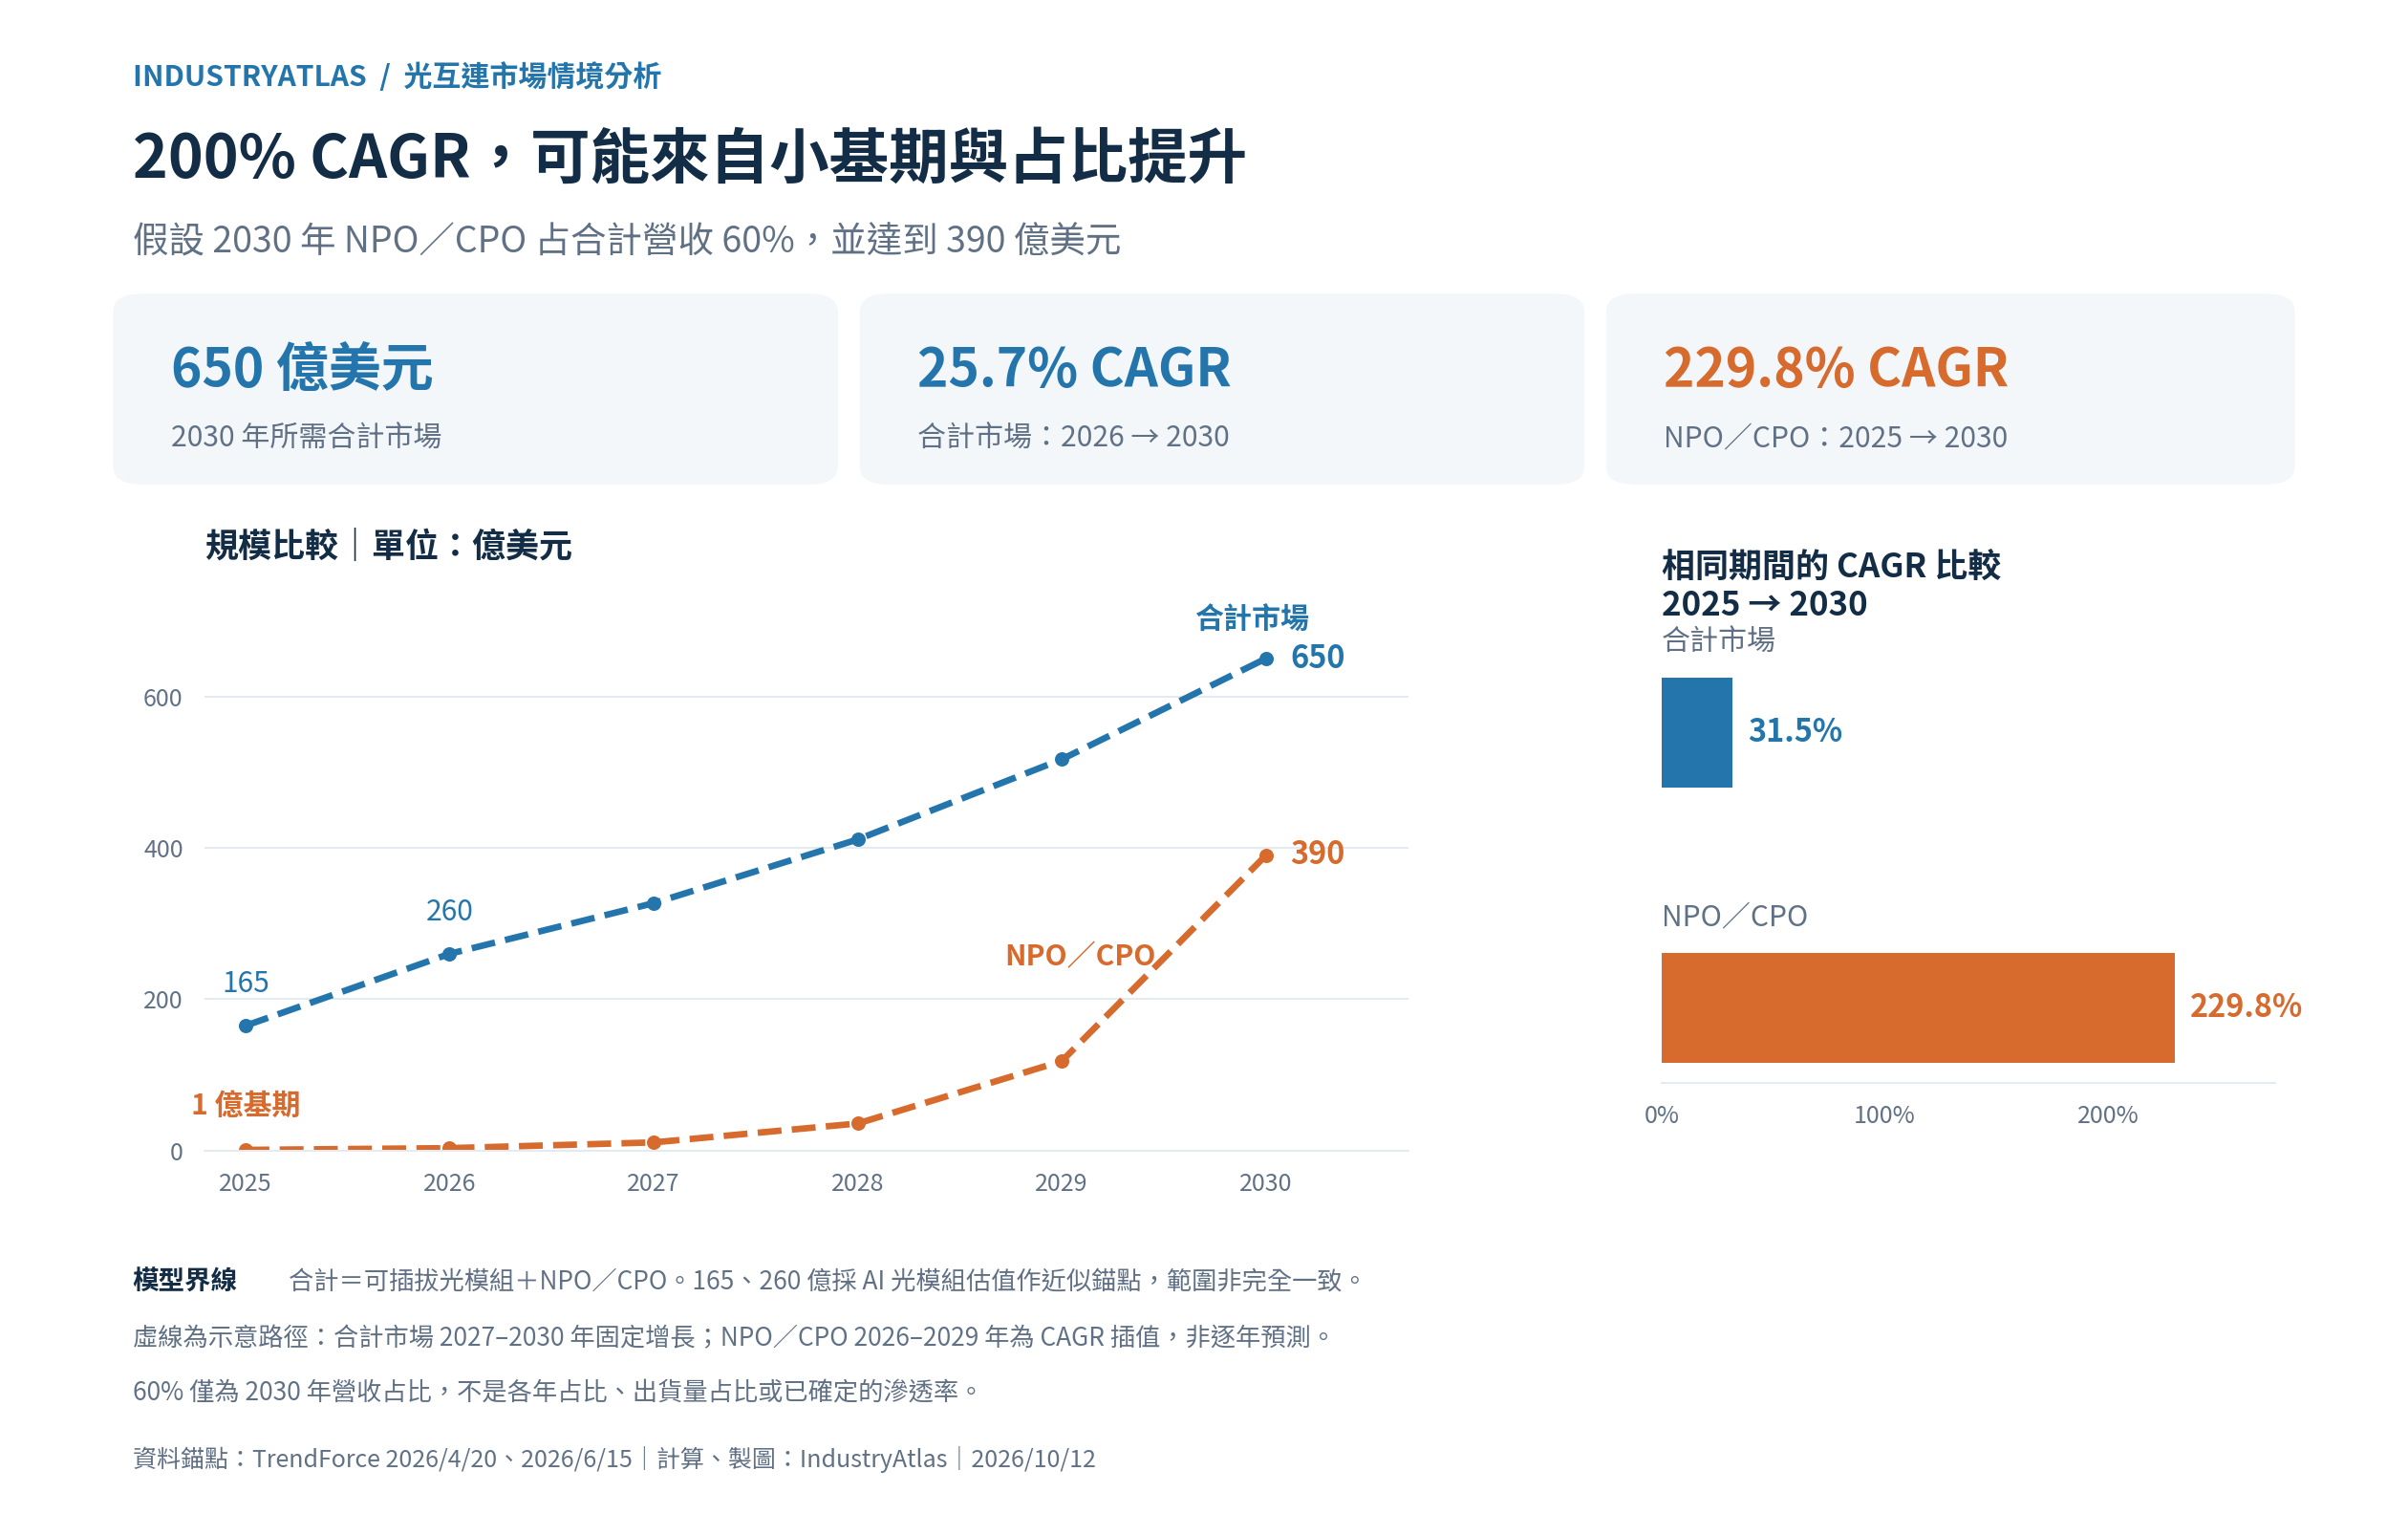
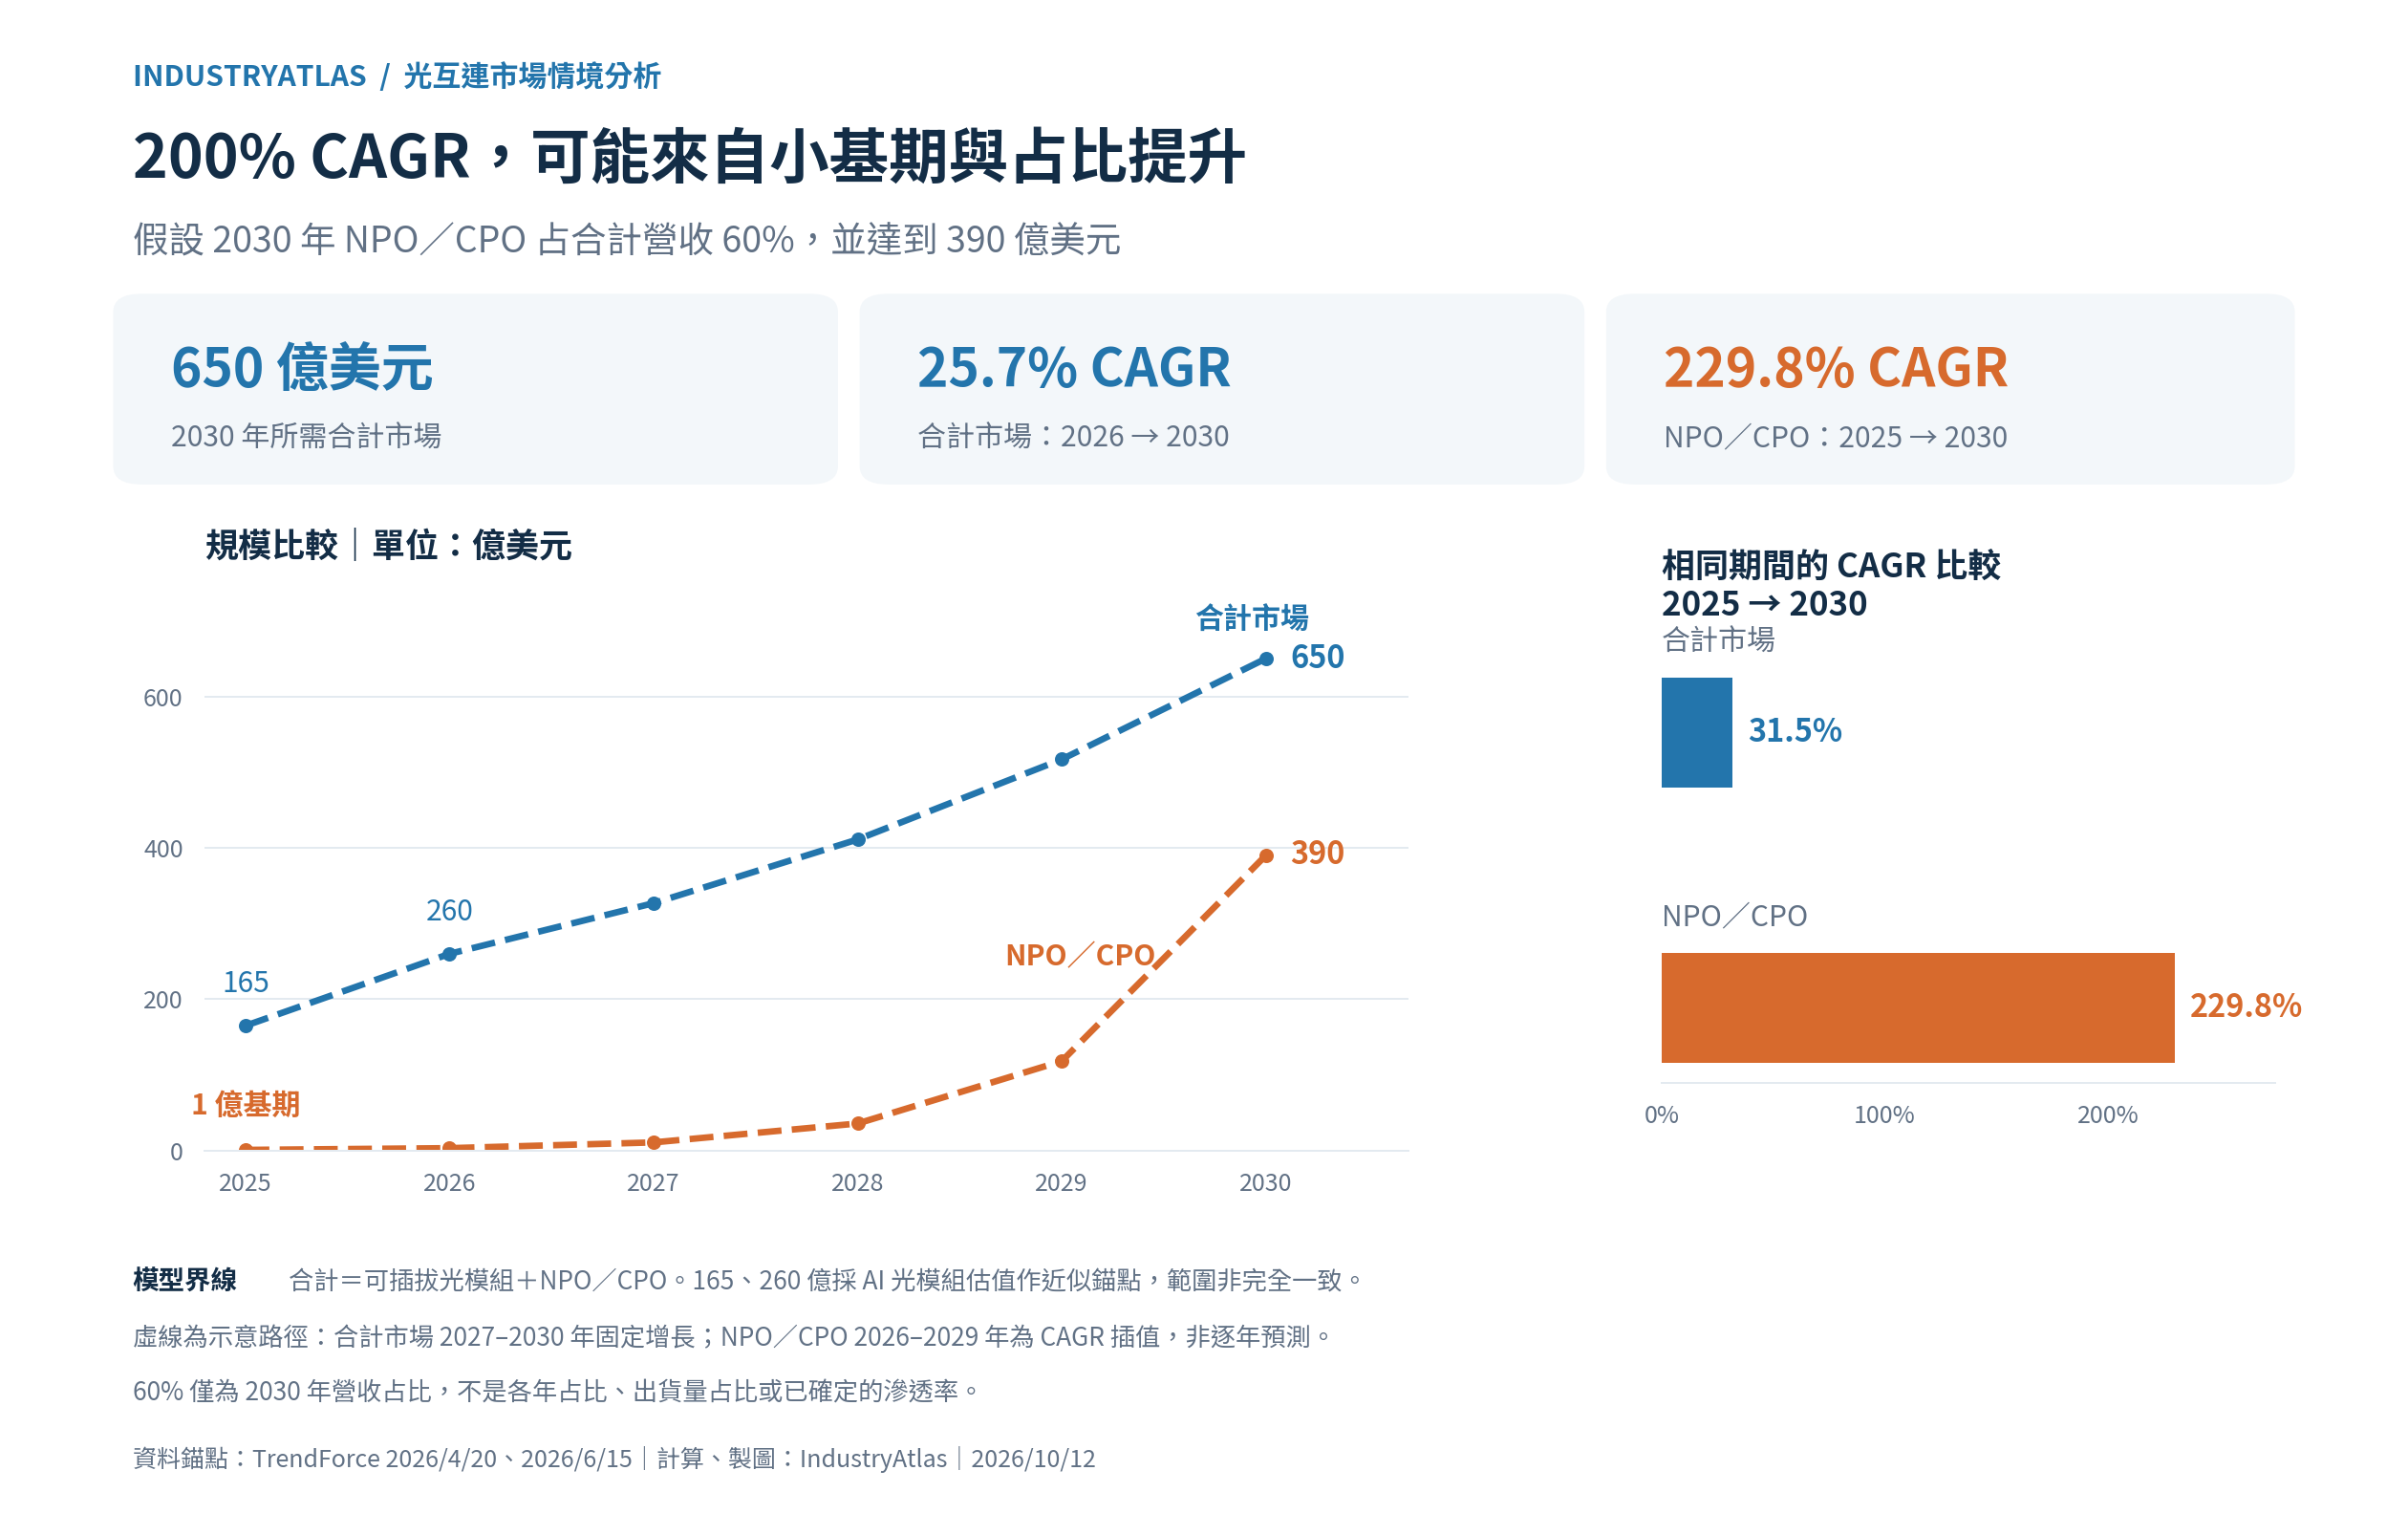
*Chart: IndustryAtlas scenario calculation. The left panel compares market size; the right compares CAGR over the same 2025–2030 period. Combined-market values for 2027–2030 are interpolated using constant 25.7% growth; NPO / CPO values for 2026–2029 use constant 229.8% CAGR. Dashed lines are illustrative paths, not research firms’ published annual shipment or revenue forecasts. The 60% share applies only to the 2030 endpoint.*
A common misreading needs clarification: 25.7% refers to the modeled combined market, not the CAGR required of pluggable modules alone. As NPO / CPO gains share, optical-interconnect spending is redistributed. The $26 billion AI-module estimate for 2026 and the model’s $26 billion remainder in 2030 have different scopes; their equality does not establish zero pluggable-market growth over four years.
High CAGR remains possible even if overall growth slows
Using the same approximate $26 billion starting point in 2026 and holding NPO / CPO’s 2030 share at 60% gives several scenarios.
| Combined-market CAGR, 2026–2030 | Combined market in 2030 | NPO / CPO at 60% | NPO / CPO CAGR, 2025–2030 |
|---|---|---|---|
| 15% | Approximately $45.5 billion | Approximately $27.3 billion | Approximately 207% |
| 20% | Approximately $53.9 billion | Approximately $32.3 billion | Approximately 218% |
| Approximately 25.7% | $65 billion | $39 billion | Approximately 230% |
| 30% | Approximately $74.3 billion | Approximately $44.6 billion | Approximately 239% |
*All figures are IndustryAtlas scenario calculations, with NPO / CPO fixed at a $100 million starting point in 2025. They are not new forecasts from the cited institutions.*
Even if subsequent combined-market growth slows to 15%–20%, a 60% share and the small starting base could still produce NPO / CPO CAGR above 200%.
That does not make 60% easy to achieve. To retain a $39 billion NPO / CPO target with only a 50% share, the combined market must reach $78 billion, requiring approximately 31.6% CAGR after 2026. At a 40% share, it must reach $97.5 billion, requiring approximately 39.2% CAGR.
High CAGR depends jointly on market expansion and rising share for the new architectures. The low base explains the large percentage; adoption determines whether it can be realized.
A 60% share also requires expansion into scale-up
Scale-out primarily connects servers or compute nodes. Scale-up enables a group of accelerators to work more closely together. Their optical-interconnect requirements have different implications for NPO / CPO.
Adopting NPO / CPO in existing optical connections mainly shifts product architecture and supplier value. Introducing optics into scale-up connections previously using copper can expand the optical market itself.[5]
The analysis therefore cannot focus only on “how many pluggable modules CPO replaces.” A larger opportunity may come from links that previously used no optical modules moving to optics. This incremental demand must not be double-counted with displaced optical modules.
In January 2026, LightCounting cross-checked AI-cluster optical demand against cloud-provider capital expenditure and identified scale-up adoption as an important variable for later expansion. Its forecast did not assume permanently unchanged high growth; it expected growth to moderate after 2027.[6]
The 60% scenario should consequently be understood as an assumption requiring aggressive adoption. Its purpose is to test whether the high CAGR is mathematically and commercially plausible in scale—not to confirm the market will follow that path.
First checkpoint: does production continue expanding in 2026–2027?
The first test is on the supply side: can suppliers deliver consistently, and can customers operate the products reliably?
TrendForce’s July 2026 tracking reported NVIDIA Spectrum-X CPO shipments to selected partners and continuing limited shipments of Broadcom Bailly, while identifying optical engines, silicon photonics, and advanced packaging as constraints on expansion.[7]
The next signals include:
- Sustained shipments: movement from samples and limited deliveries to several consecutive quarters of rising shipments and revenue. - Improving yields and capacity: whether packaging, optical coupling, and testing keep pace, and whether new lines produce deliverable products. - Repeat customer purchasing: expansion from small deployments into more racks and data centers. - Manageable deployment and maintenance: whether long-duration operation, failure handling, and replacement procedures support larger-scale use.
Together, these signals would more strongly support the view that production bottlenecks are being overcome. Shipment of one product does not establish production readiness for every NPO / CPO approach. Timetables may differ: TrendForce, for example, expected some VCSEL-based NPO solutions to launch in 2027–2028.[8]
Second checkpoint: does AI growth become optical-interconnect orders in 2028?
By 2028, the focus should gradually shift from “can it be manufactured?” to “is there enough actual demand?”
Continued AI demand is important, but it must pass through data-center construction, equipment delivery, and architecture adoption before becoming NPO / CPO revenue. TrendForce links acceleration in 2028–2029 to optical adoption in scale-up architectures, a key step in that conversion.[2]
| What to monitor in 2028 | Useful signals |
|---|---|
| Persistence of AI demand | Whether training, inference, and actual service usage support continued cloud compute expansion |
| Investment becoming deployed capacity | Actual delivery and commissioning of data centers, power, and servers, beyond capital-expenditure announcements |
| Growth in optical-interconnect spending | Continued increases in high-speed optical-product orders, bandwidth requirements, and realized revenue |
| Scale-up entering production platforms | New accelerator and switching architectures moving from demonstrations and validation to volume deployment |
| Rising NPO / CPO share | How much incremental demand adopts NPO / CPO rather than retaining copper or pluggable solutions |
If AI infrastructure continues expanding in 2028, production improves, and scale-up optical interconnects generate actual orders, forecasts above 200% CAGR will gain stronger support.
If AI demand persists but major platforms delay adoption, the optical-module market could continue growing while NPO / CPO revenue falls short of expectations. The two need separate monitoring.
IndustryAtlas’s current assessment is that from a 2025 base of approximately $100 million, NPO / CPO CAGR near or above 200% has an industry rationale. In the approximate model with a 60% revenue share in 2030, overall market growth in the tens of percent can support several-fold annual growth for the new architectures.
Watch first for sustained production scaling in 2026–2027, then for AI growth, actual deployment, and scale-up adoption in 2028. These observable signals will reveal whether forecasts are being realized or need adjustment earlier than the CAGR figure itself.